
2.3 National TB prevalence surveys
To reliably track the burden of tuberculosis (TB) disease in terms of TB incidence and TB mortality from subnational to global levels, the ultimate goal is that all countries can rely on data routinely collected through national disease surveillance and
vital registration (VR) systems. Currently, all countries have national systems for notification (i.e. reporting) of TB cases and most report national notification data to the World Health Organization (WHO) on an annual basis (Section 3).
However, in many countries (including most high TB burden countries) the number of notified cases each year is not a good proxy for the actual number of people who develop TB disease, for two reasons. The first is underreporting of people diagnosed
with TB, especially in countries with large private sectors or in which people with TB seek care in public facilities that are not linked to the national TB programme and its associated reporting systems. The second is underdiagnosis, especially in
countries with geographic or financial barriers to seeking health care. Many countries (including most high TB burden countries) do not have established national VR systems of high quality and coverage that can be used to reliably monitor the number
of deaths and their cause (1).
In countries with a relatively high burden of TB disease that do not yet have national disease notification and VR systems of sufficiently high quality and coverage, national TB prevalence surveys are the best way to directly measure the burden of TB
disease in the population (2, 3, 4). In terms of disease burden, WHO currently recommends consideration of surveys in countries with an estimated TB incidence of ≥150 per 100 000 population per year (3, 4).
National TB prevalence surveys can provide a reliable measurement of the number of people in the population with bacteriologically confirmed pulmonary TB at a given point in time, and the distribution of these cases by age and sex. In addition, repeat
surveys allow assessment of trends, and of the impact of interventions to reduce the burden of disease in the period since the last survey. WHO recommends that surveys focus on people aged 15 years or over (2). Results can be used to
inform national estimates of TB incidence in all age groups, and can thus help to track progress towards the milestones and targets for reductions in TB incidence set in the End TB Strategy (Section 2.1,
Fig. 2.1.8a). Previously, survey results were also important for the assessment of progress towards global, regional and national targets for reductions in TB prevalence between 1990 and 2015.
For these reasons, the implementation of national TB prevalence surveys in 22 priority countries (referred to as global focus countries, GFCs) was one of three strategic areas of work defined by the WHO Global Task Force on TB Impact Measurement (the
Task Force) for the period 2007–2015 (2, 3). National TB prevalence surveys were retained as one of the Task Force’s strategic areas of work after 2015 (4, 5).
Other benefits of prevalence surveys include that they can be used to document health care seeking behaviour in the public and private sectors, assess variation in underreporting or underdiagnosis of TB by age and sex (using the ratio of prevalence to notifications), and quantify the extent of underreporting of people diagnosed with TB to national authorities. Findings can help to inform the development or improvement of TB case finding, diagnosis and treatment interventions.
Countries in which national prevalence surveys were implemented in 2000–2021 or are planned to start in 2022 are shown in Fig. 2.3.1 and Fig. 2.3.2. Between 2007 and the end of 2019, a total of 33 surveys that used the screening and diagnostic methods recommended by WHO (2) were completed in 30 countries (with repeat surveys in Myanmar, the Philippines and Viet Nam). These 30 countries comprised 17 in Africa and 13 in Asia, and 20 of the 22 GFCs. No surveys were completed in 2020, with the first national TB prevalence survey in India delayed by the COVID-19 pandemic. However, as of August 2021, the field operations of the survey in India were ongoing and scheduled for completion by the end of the year. The survey is one of the largest ever undertaken, with a planned sample size of about 500 000 people. Preparations for repeat surveys in Cambodia and Pakistan are underway.
Surveys showed that the estimated prevalence of bacteriologically confirmed pulmonary TB per 100 000 population aged 15 years or over was high in many countries, but there was also considerable variation (Fig. 2.3.3).
In African countries, prevalence ranged from 119 (95% confidence interval [CI]: 79–160) per 100 000 population in Rwanda (in 2012) to 852 (95% CI: 679–1026) per 100 000 population in South Africa (in 2017). In Asian countries,
prevalence ranged from 119 (95% CI: 103–135) per 100 000 population in China (in 2010) to 1159 (95% CI: 1016–1301) per 100 000 population in the Philippines (in 2016).
In most Asian countries and some African countries, prevalence increased with age (Fig. 2.3.4, Fig. 2.3.5). As transmission declines, more incident cases arise from past rather than recent infection. Therefore,
a pattern in which prevalence increases with age suggests that transmission is falling. It is encouraging that prevalence surveys indicated that transmission is potentially declining in many Asian countries and in several African countries (e.g. Ghana,
Lesotho, Malawi, Mozambique, Rwanda and the United Republic of Tanzania). Elsewhere, surveys suggested considerable community transmission; peaks in many African countries in the age groups 35–44 or 45–54 years also reflect the impact
of the HIV epidemic.
A striking finding across all surveys was the much higher burden of TB disease in men compared with women (Fig. 2.3.6). The male to female (M:F) ratio of bacteriologically confirmed pulmonary cases in surveys completed in 2007–2019
ranged from 1.2 (in Ethiopia) to 4.5 (in Viet Nam); in most countries it was in the range 2–4. These findings mean that men typically account for about 66–75% of the burden of TB disease in adults.
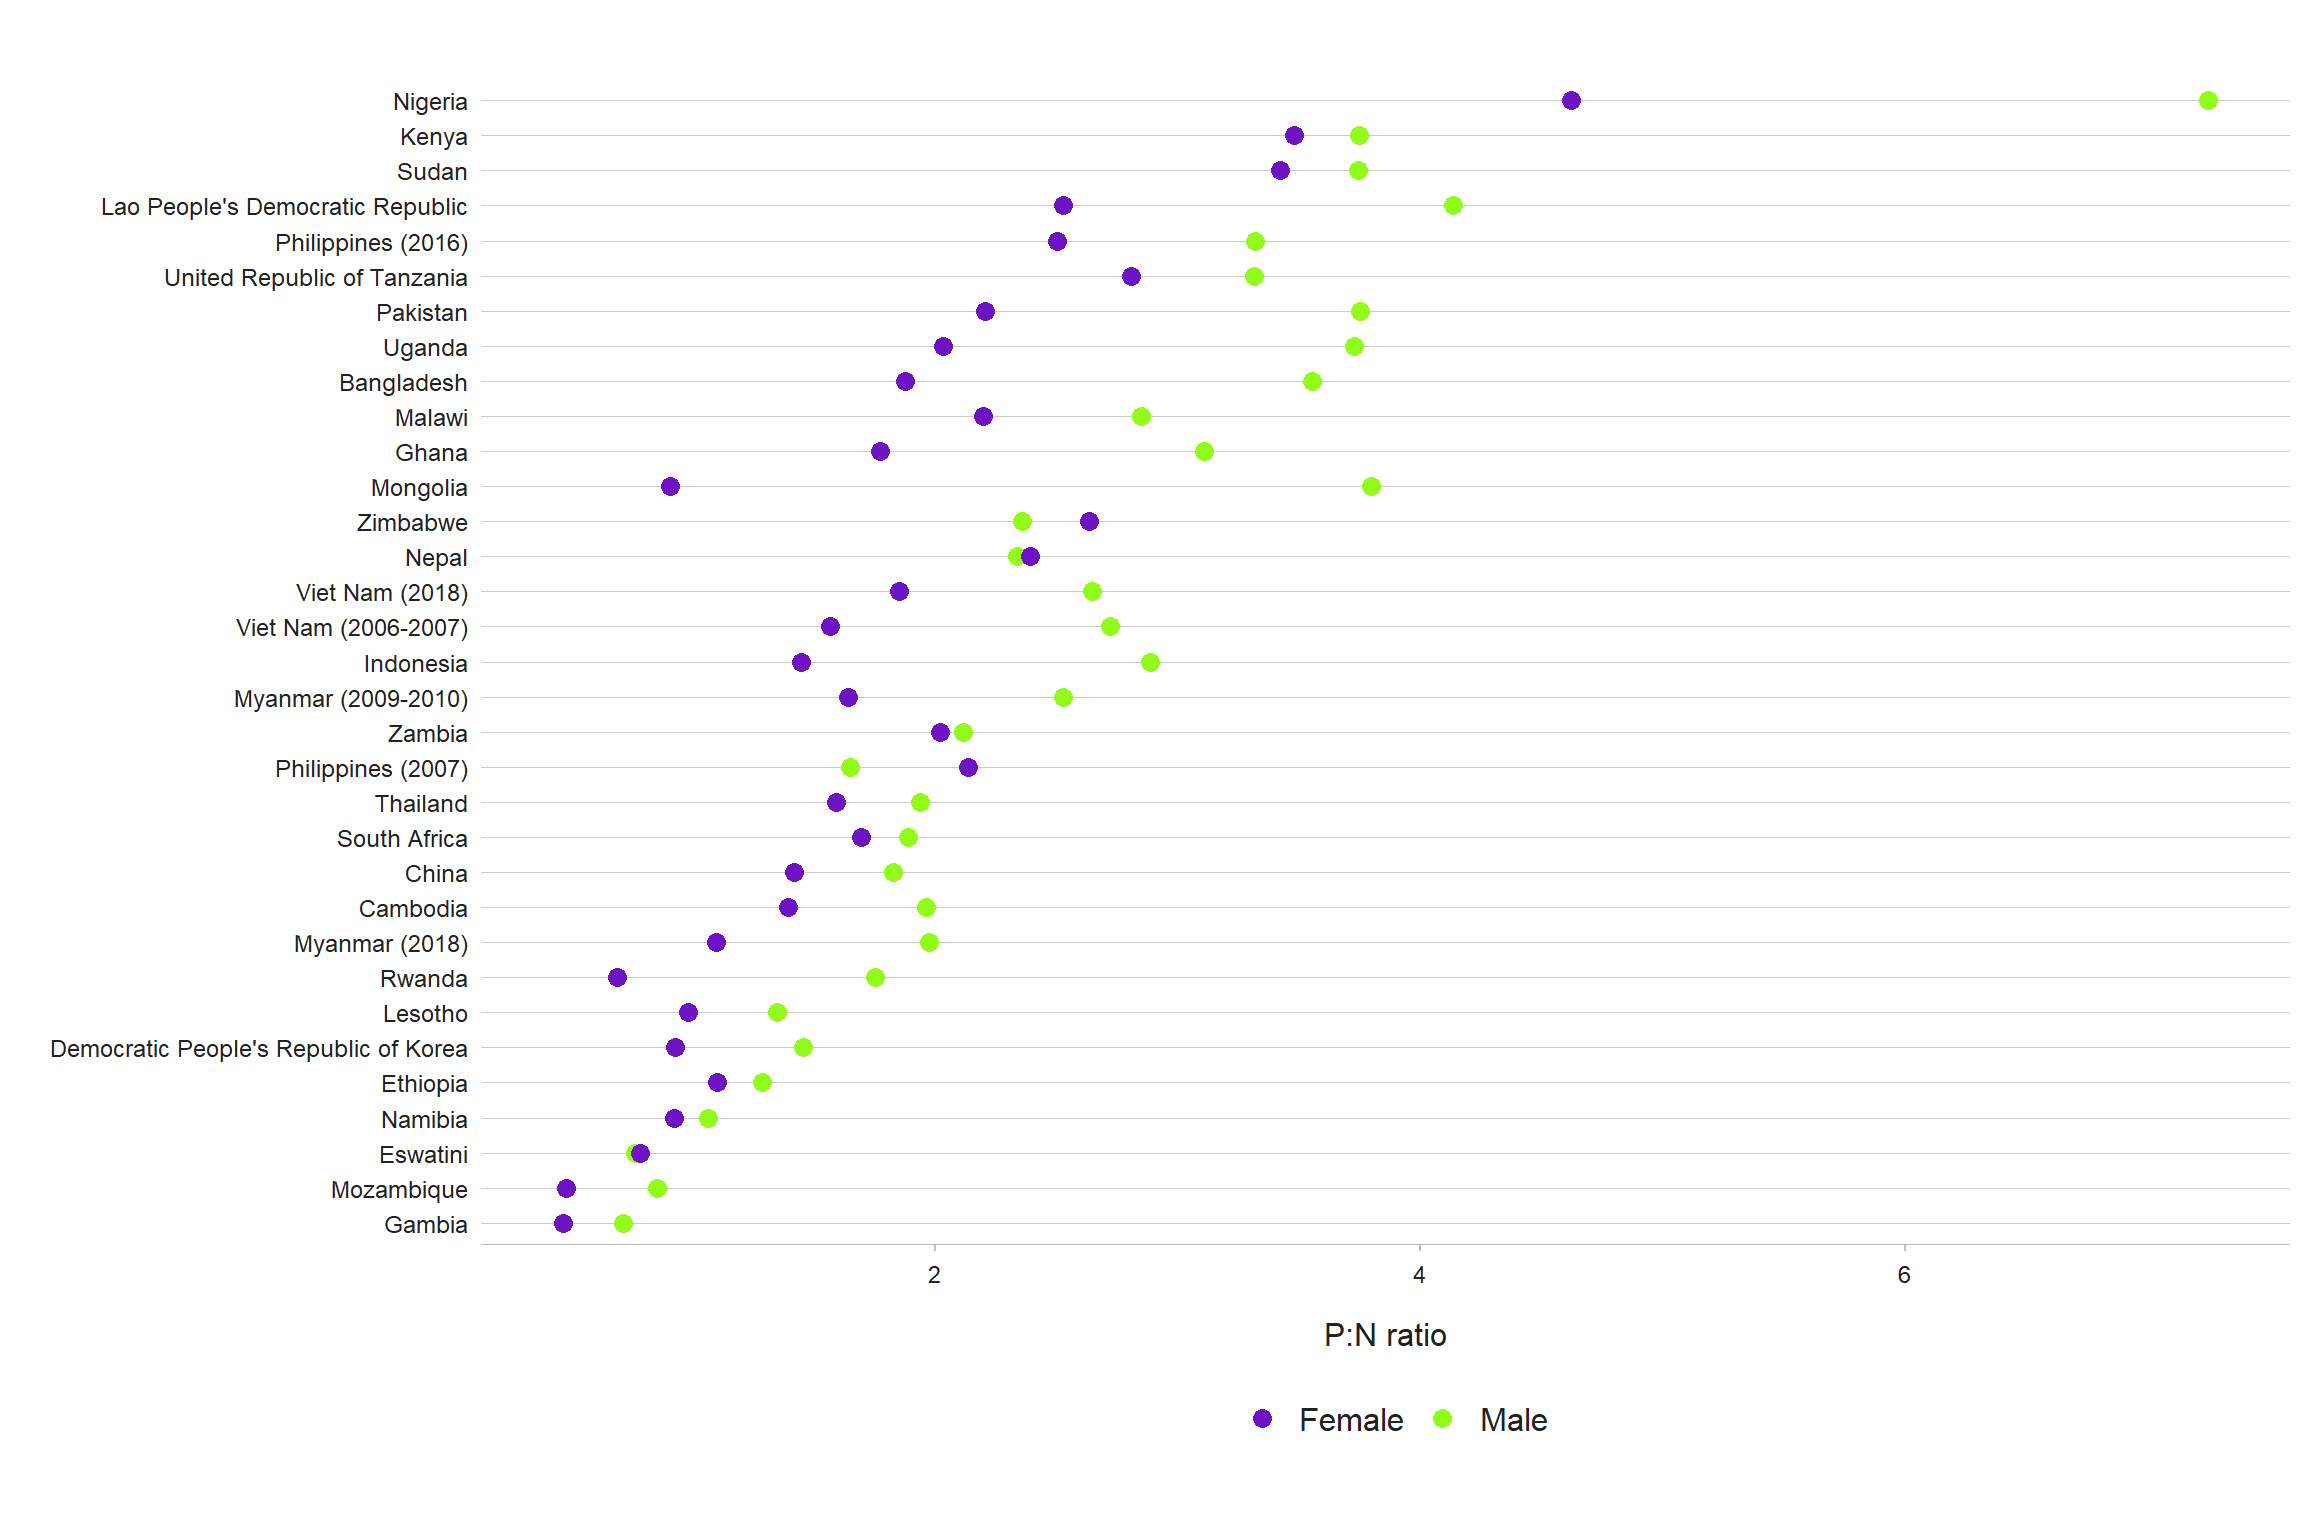
Ratios of prevalence to notifications (P:N, expressed in years) suggest marginally higher detection and reporting gaps in Asia compared with Africa, and lower detection and reporting gaps among women compared with men (Fig. 2.3.7, Fig. 2.3.8). The combination of a higher disease burden in men and larger gaps in detection and reporting indicates a need for strategies to improve access to and use of health services among men (6).
A WHO 2021 publication provides full details about the results and lessons learned from the 25 national surveys implemented in 2007–2016 (3). In addition, regional syntheses of survey results and lessons learned are available in journal articles (7, 8).
A third edition of the WHO handbook on national TB prevalence surveys is in development and is scheduled for completion in 2022.
Fig. 2.3.1 National surveys of the prevalence of TB disease, actual (2000–2021) and planned (2022)

b The surveys in Bangladesh (2008) and Eritrea (2005) collected sputum samples from all individuals (aged ≥ 15 years), and did not use chest X-ray and/or a symptom questionnaire to screen individuals for sputum submission.
c Field operations are ongoing.
Fig. 2.3.2 Countries in which national population-based surveys of the prevalence of TB disease have been implemented using currently recommended screening and diagnostic methods since 2000 or are planned (status in August 2021)a
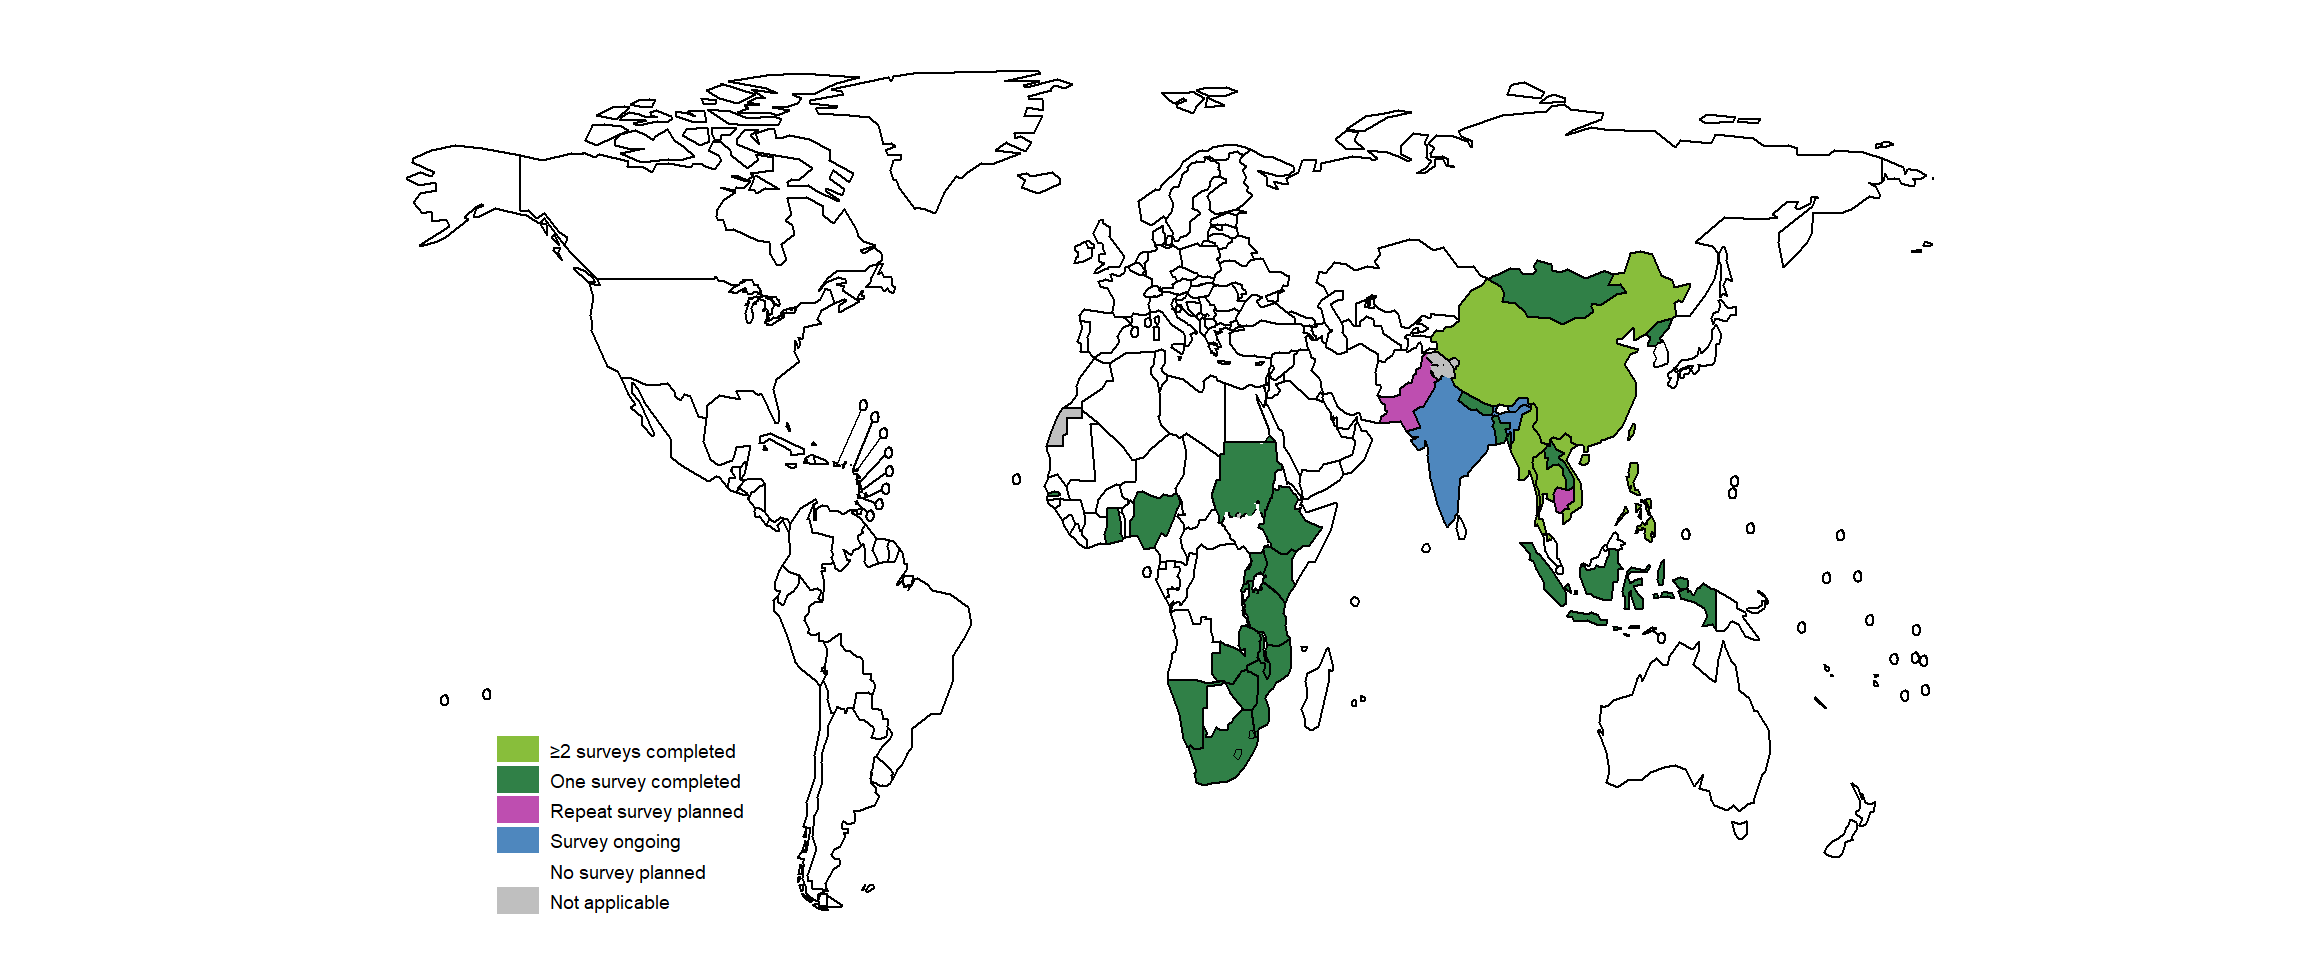
Fig. 2.3.3 Estimates of the prevalence of bacteriologically confirmed pulmonary TB in surveys completed 2007–2019a
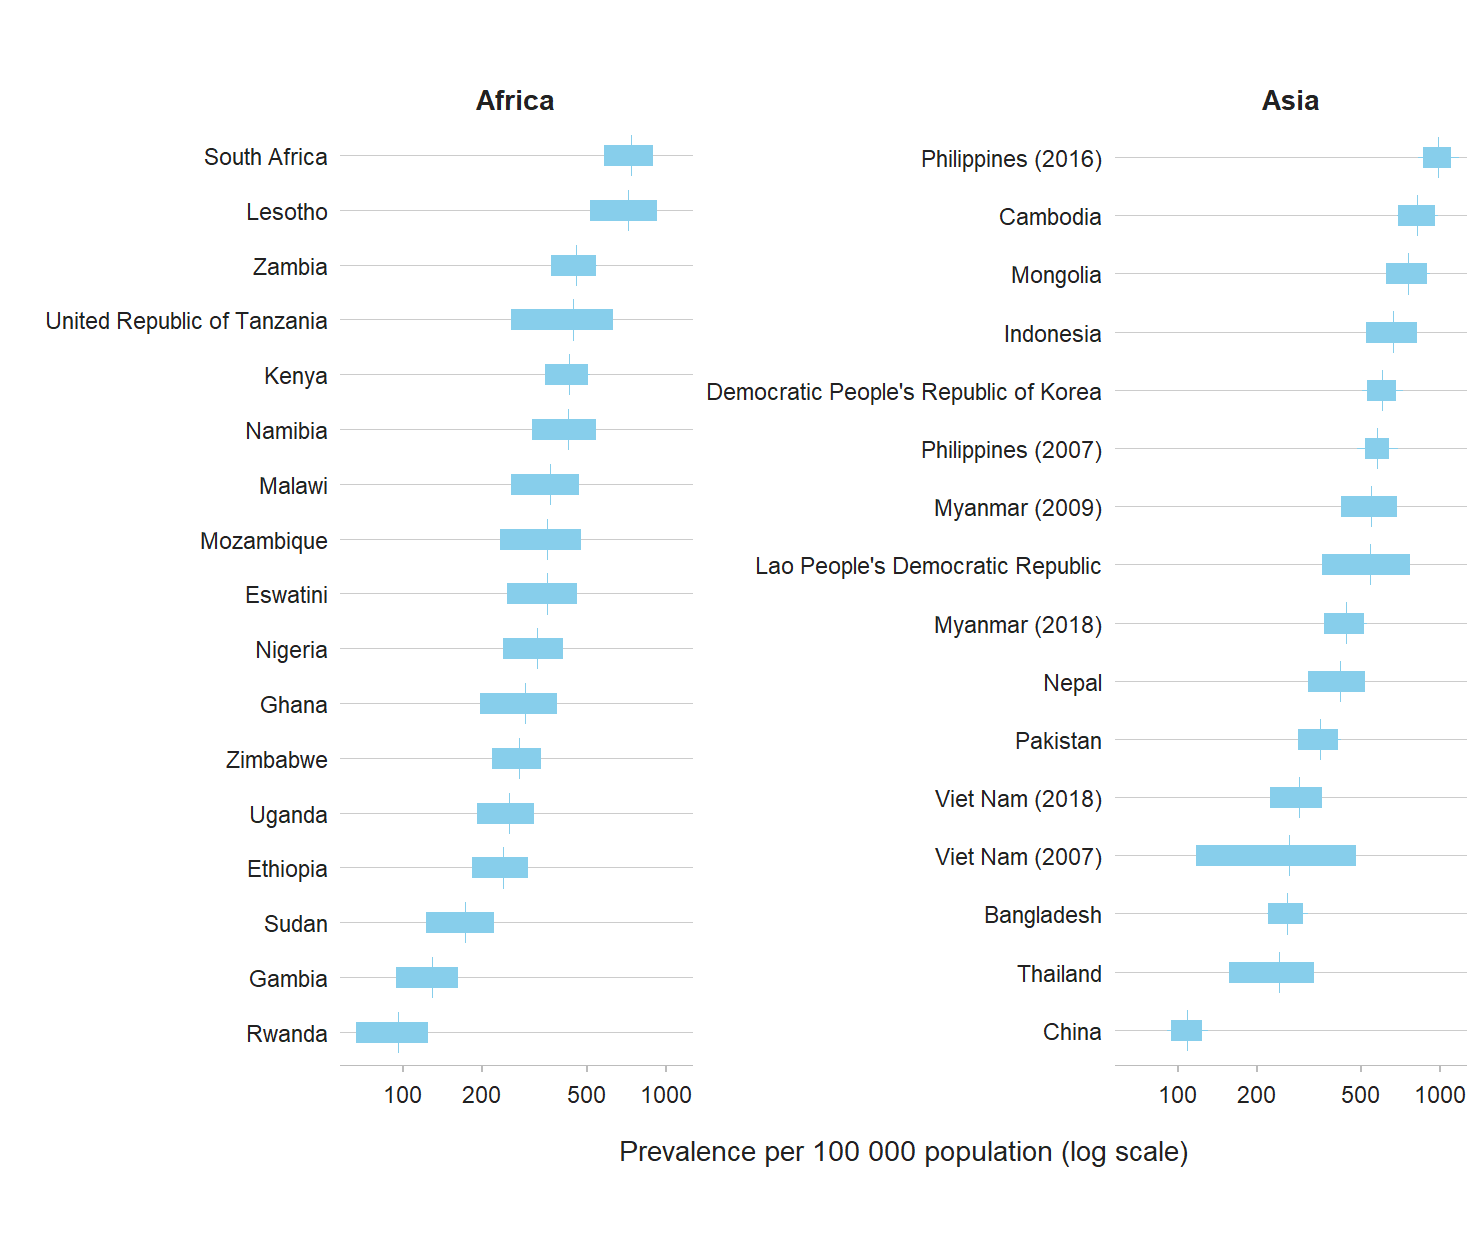
Fig. 2.3.4 Estimated age-specific prevalence of bacteriologically confirmed pulmonary TB for surveys implemented in Africa, 2010–2019a
The red line denotes the best estimate and the blue shaded areas are the 95% confidence intervals.
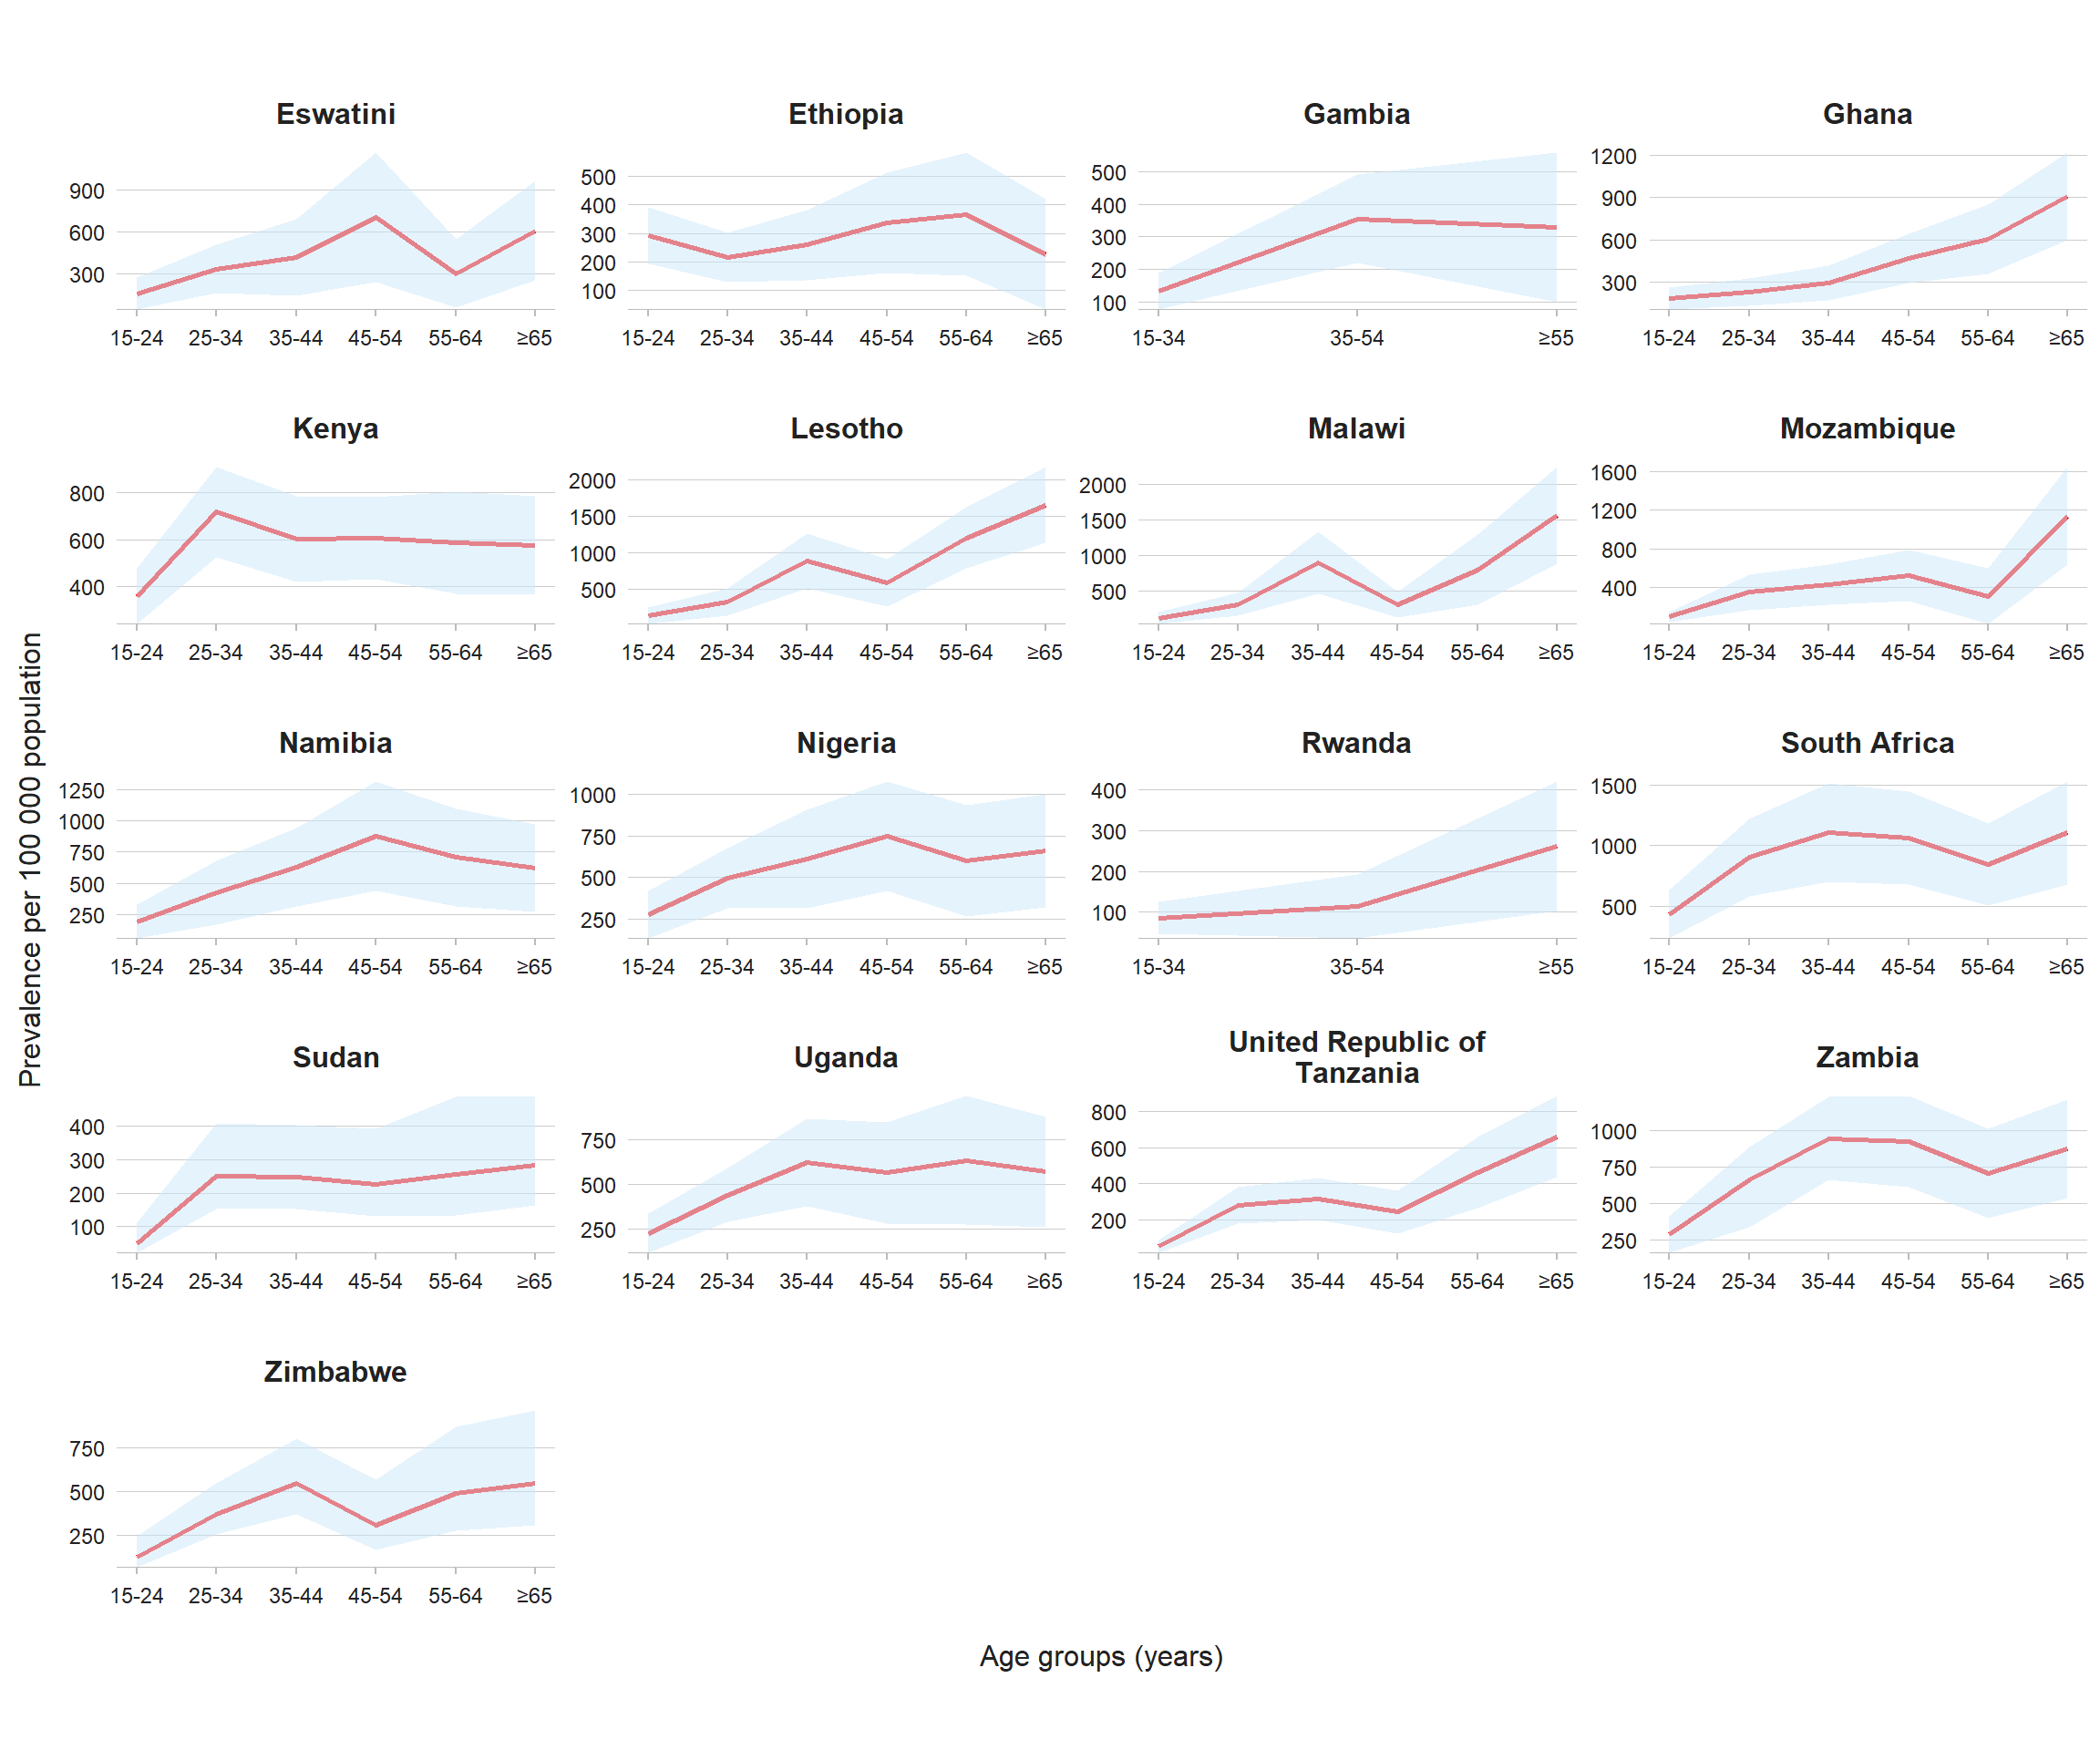
Fig. 2.3.5 Estimated age-specific prevalence of bacteriologically confirmed pulmonary TB for surveys implemented in Asia, 2007–2019

Fig. 2.3.6 The male to female ratio of bacteriologically confirmed adult TB cases detected in prevalence surveys implemented 2007–2020a

Fig. 2.3.7 The prevalence to notification (P:N) ratio of adult TB cases in prevalence surveys implemented 2007–2020
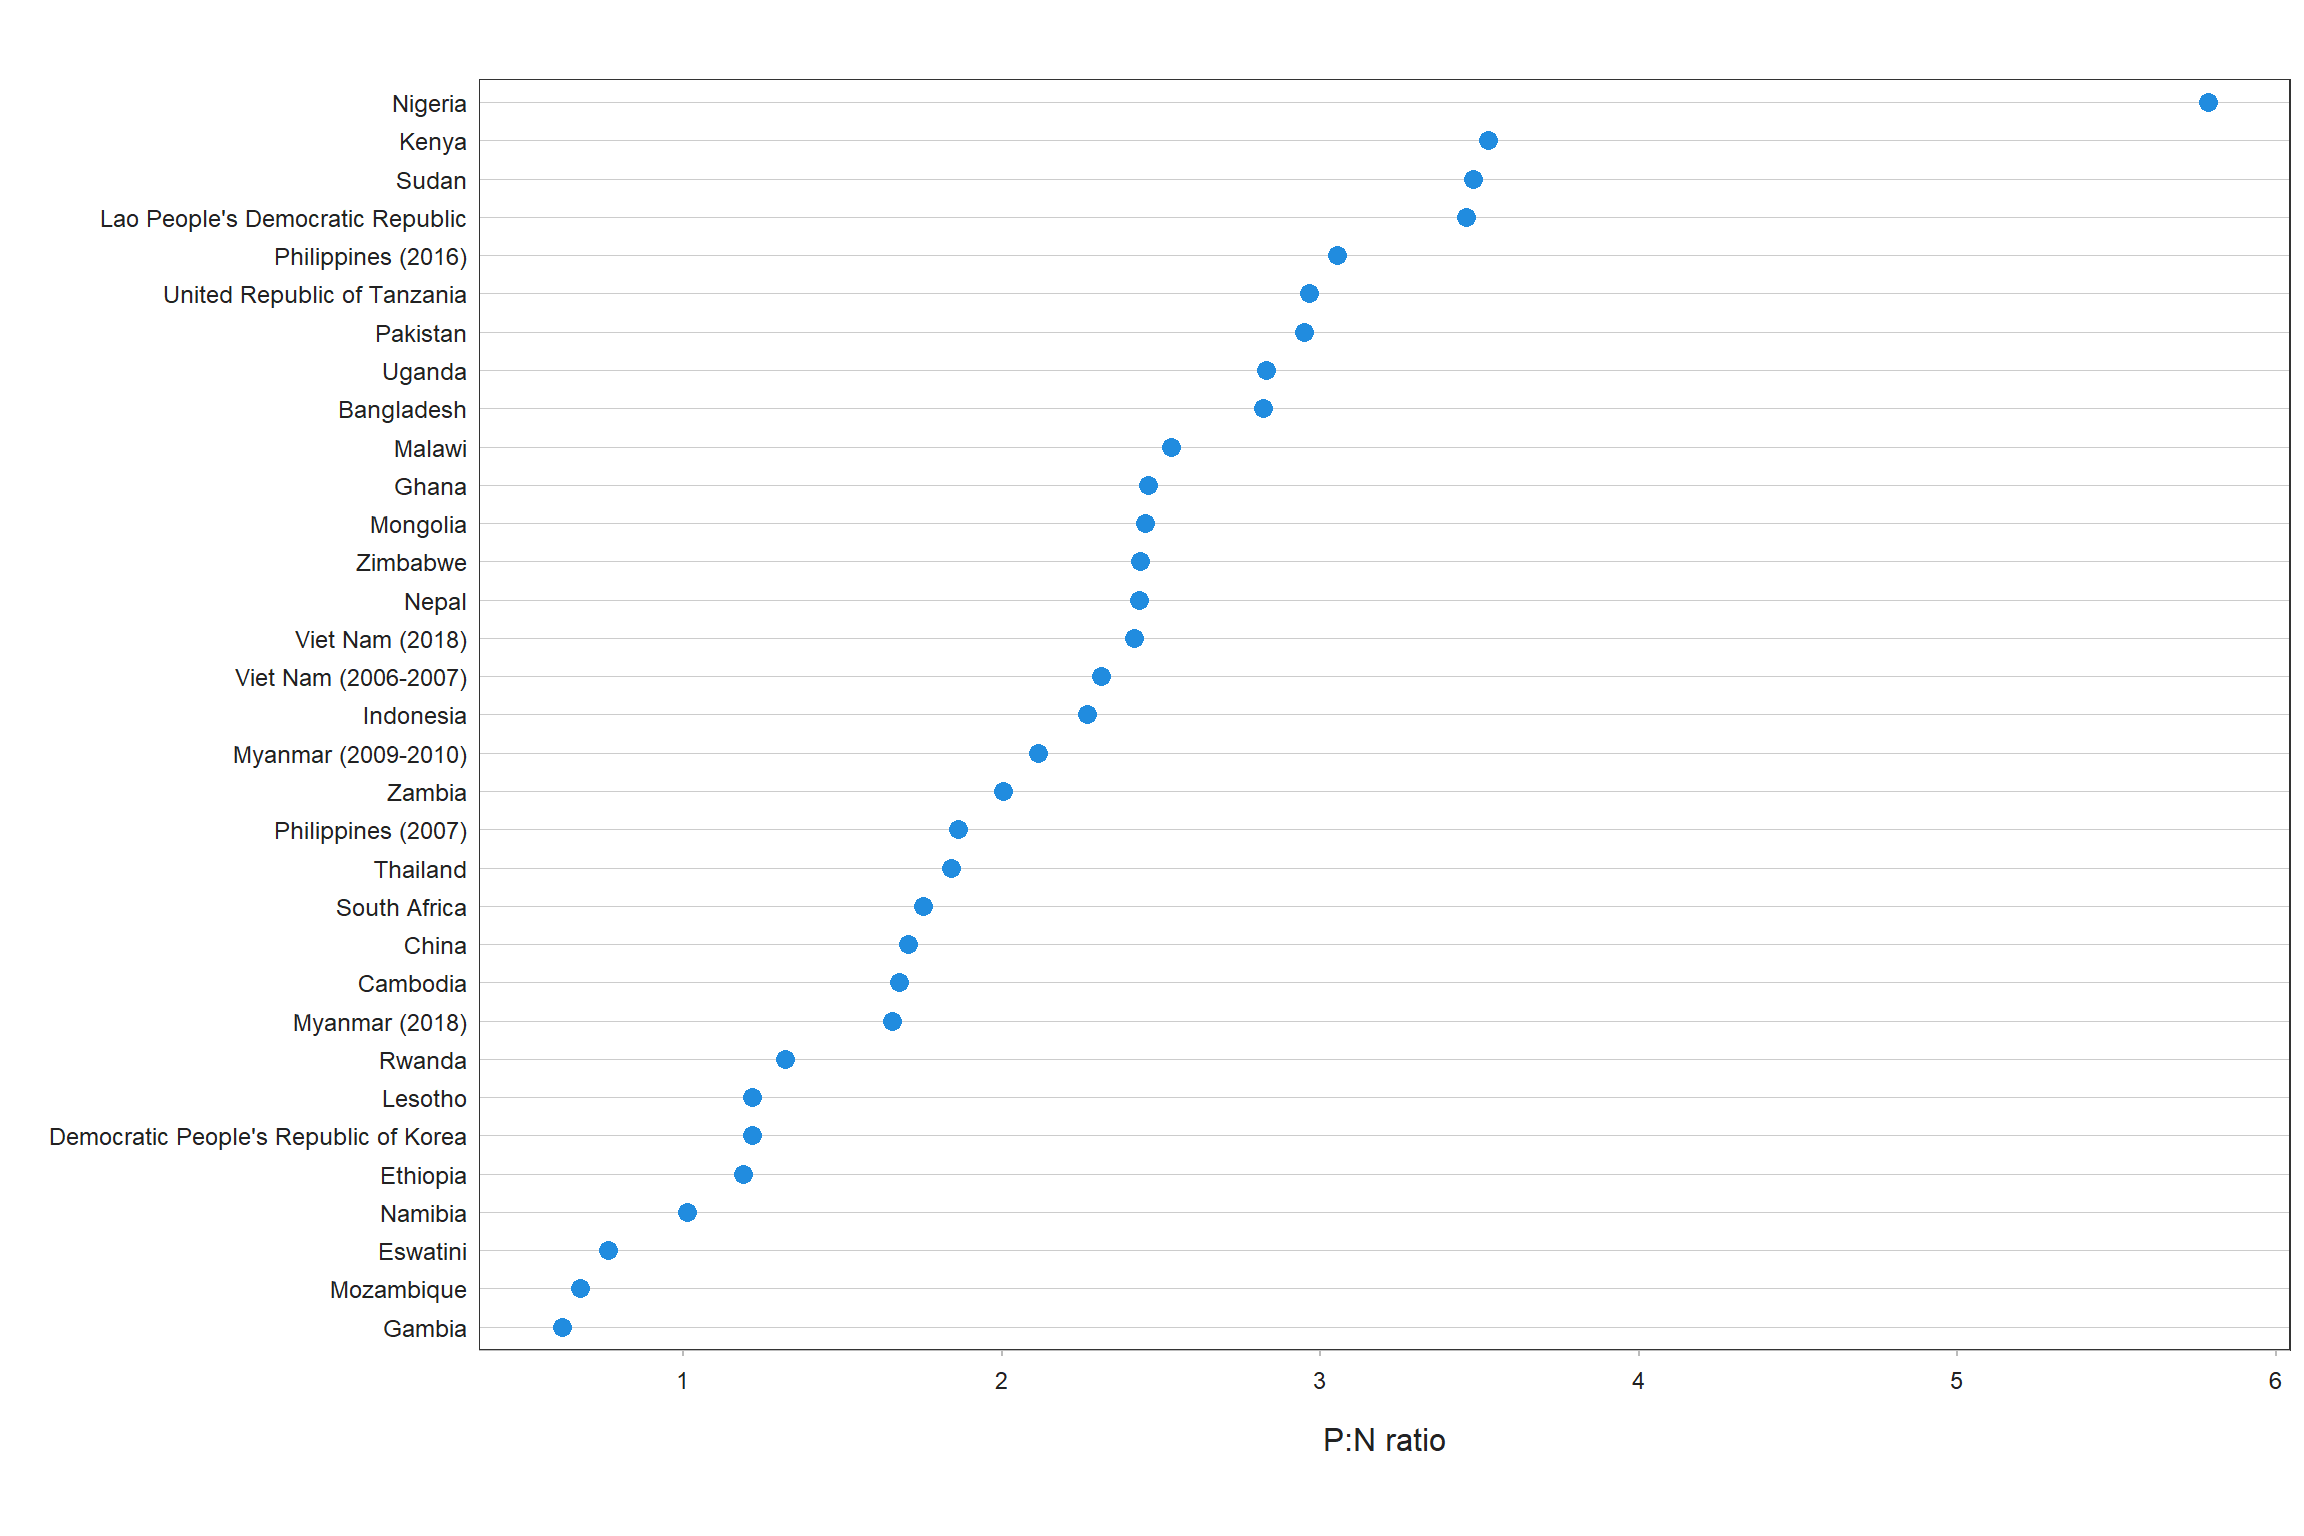
Fig. 2.3.8 The prevalence to notification (P:N) ratio by sex for adult TB cases in prevalence surveys implemented 2007–2020
References
- Mikkelsen L, Phillips DE, AbouZahr C, Setel PW, de Savigny D, Lozano R et al. A global assessment of civil registration and vital statistics systems: monitoring data quality and progress. Lancet. 2015;386(10001):1395–406 (https://www.ncbi.nlm.nih.gov/pubmed/25971218).
- Tuberculosis prevalence surveys: a handbook (WHO/HTM/TB/2010.17). Geneva: World Health Organization; 2011 (https://www.who.int/publications/i/item/9789241548168).
- National tuberculosis prevalence surveys, 2007–2016. Geneva: World Health Organization; 2021 (https://www.who.int/publications/i/item/9789240022430).
- World Health Organization Global Task Force on TB Impact Measurement. Report of the sixth meeting of the full Task Force; 19–21 April 2016, Glion-sur-Montreux, Switzerland. Geneva: World Health Organization; 2016 (https://www.who.int/tb/advisory_bodies/impact_measurement_taskforce/meetings/tf6_report.pdf?ua=1).
- Fact sheet on the WHO Global Task Force on TB Impact Measurement (May 2021). Geneva: World Health Organization; 2021 (https://cdn.who.int/media/docs/default-source/hq-tuberculosis/global-task-force-on-tb-impact-measurement/tf_brochure_may2021.pdf?sfvrsn=38e1e4b7_3).
- Horton KC, MacPherson P, Houben RM, White RG, Corbett EL. Sex differences in tuberculosis burden and notifications in low- and middle-income countries: a systematic review and meta-analysis. PLoS Med. 2016;13(9):e1002119 (https://www.ncbi.nlm.nih.gov/pubmed/27598345).
- Onozaki I, Law I, Sismanidis C, Zignol M, Glaziou P, Floyd K. National tuberculosis prevalence surveys in Asia, 1990–2012: an overview of results and lessons learned. Trop Med Int Health. 2015 Sep;20(9):1128–1145 (https://pubmed.ncbi.nlm.nih.gov/25943163).
- Law I, Floyd K, African TB Prevalence Survey Group. National tuberculosis prevalence surveys in Africa, 2008–2016: an overview of results and lessons learned. Trop Med Int Health. 2020 Nov;25(11):1308–1327 (https://pubmed.ncbi.nlm.nih.gov/32910557).