Influenza Update N° 465
Overview
19 February 2024, based on data up to 4 February 2023
Information in this report is categorized by influenza transmission zones, which are geographical groups of countries, areas or territories with similar influenza transmission patterns. For more information on influenza transmission zones, see the link below:
Influenza Transmission Zones (pdf, 659kb)
- Countries are recommended to monitor the relative co-circulation of influenza and SARS-CoV-2 viruses in integrated surveillance and report to RespiMART (FluNet and FluID) directly or via regional platforms. Clinicians should consider influenza in differential diagnosis, especially for high-risk groups for influenza, and test and treat according to national and WHO guidance.
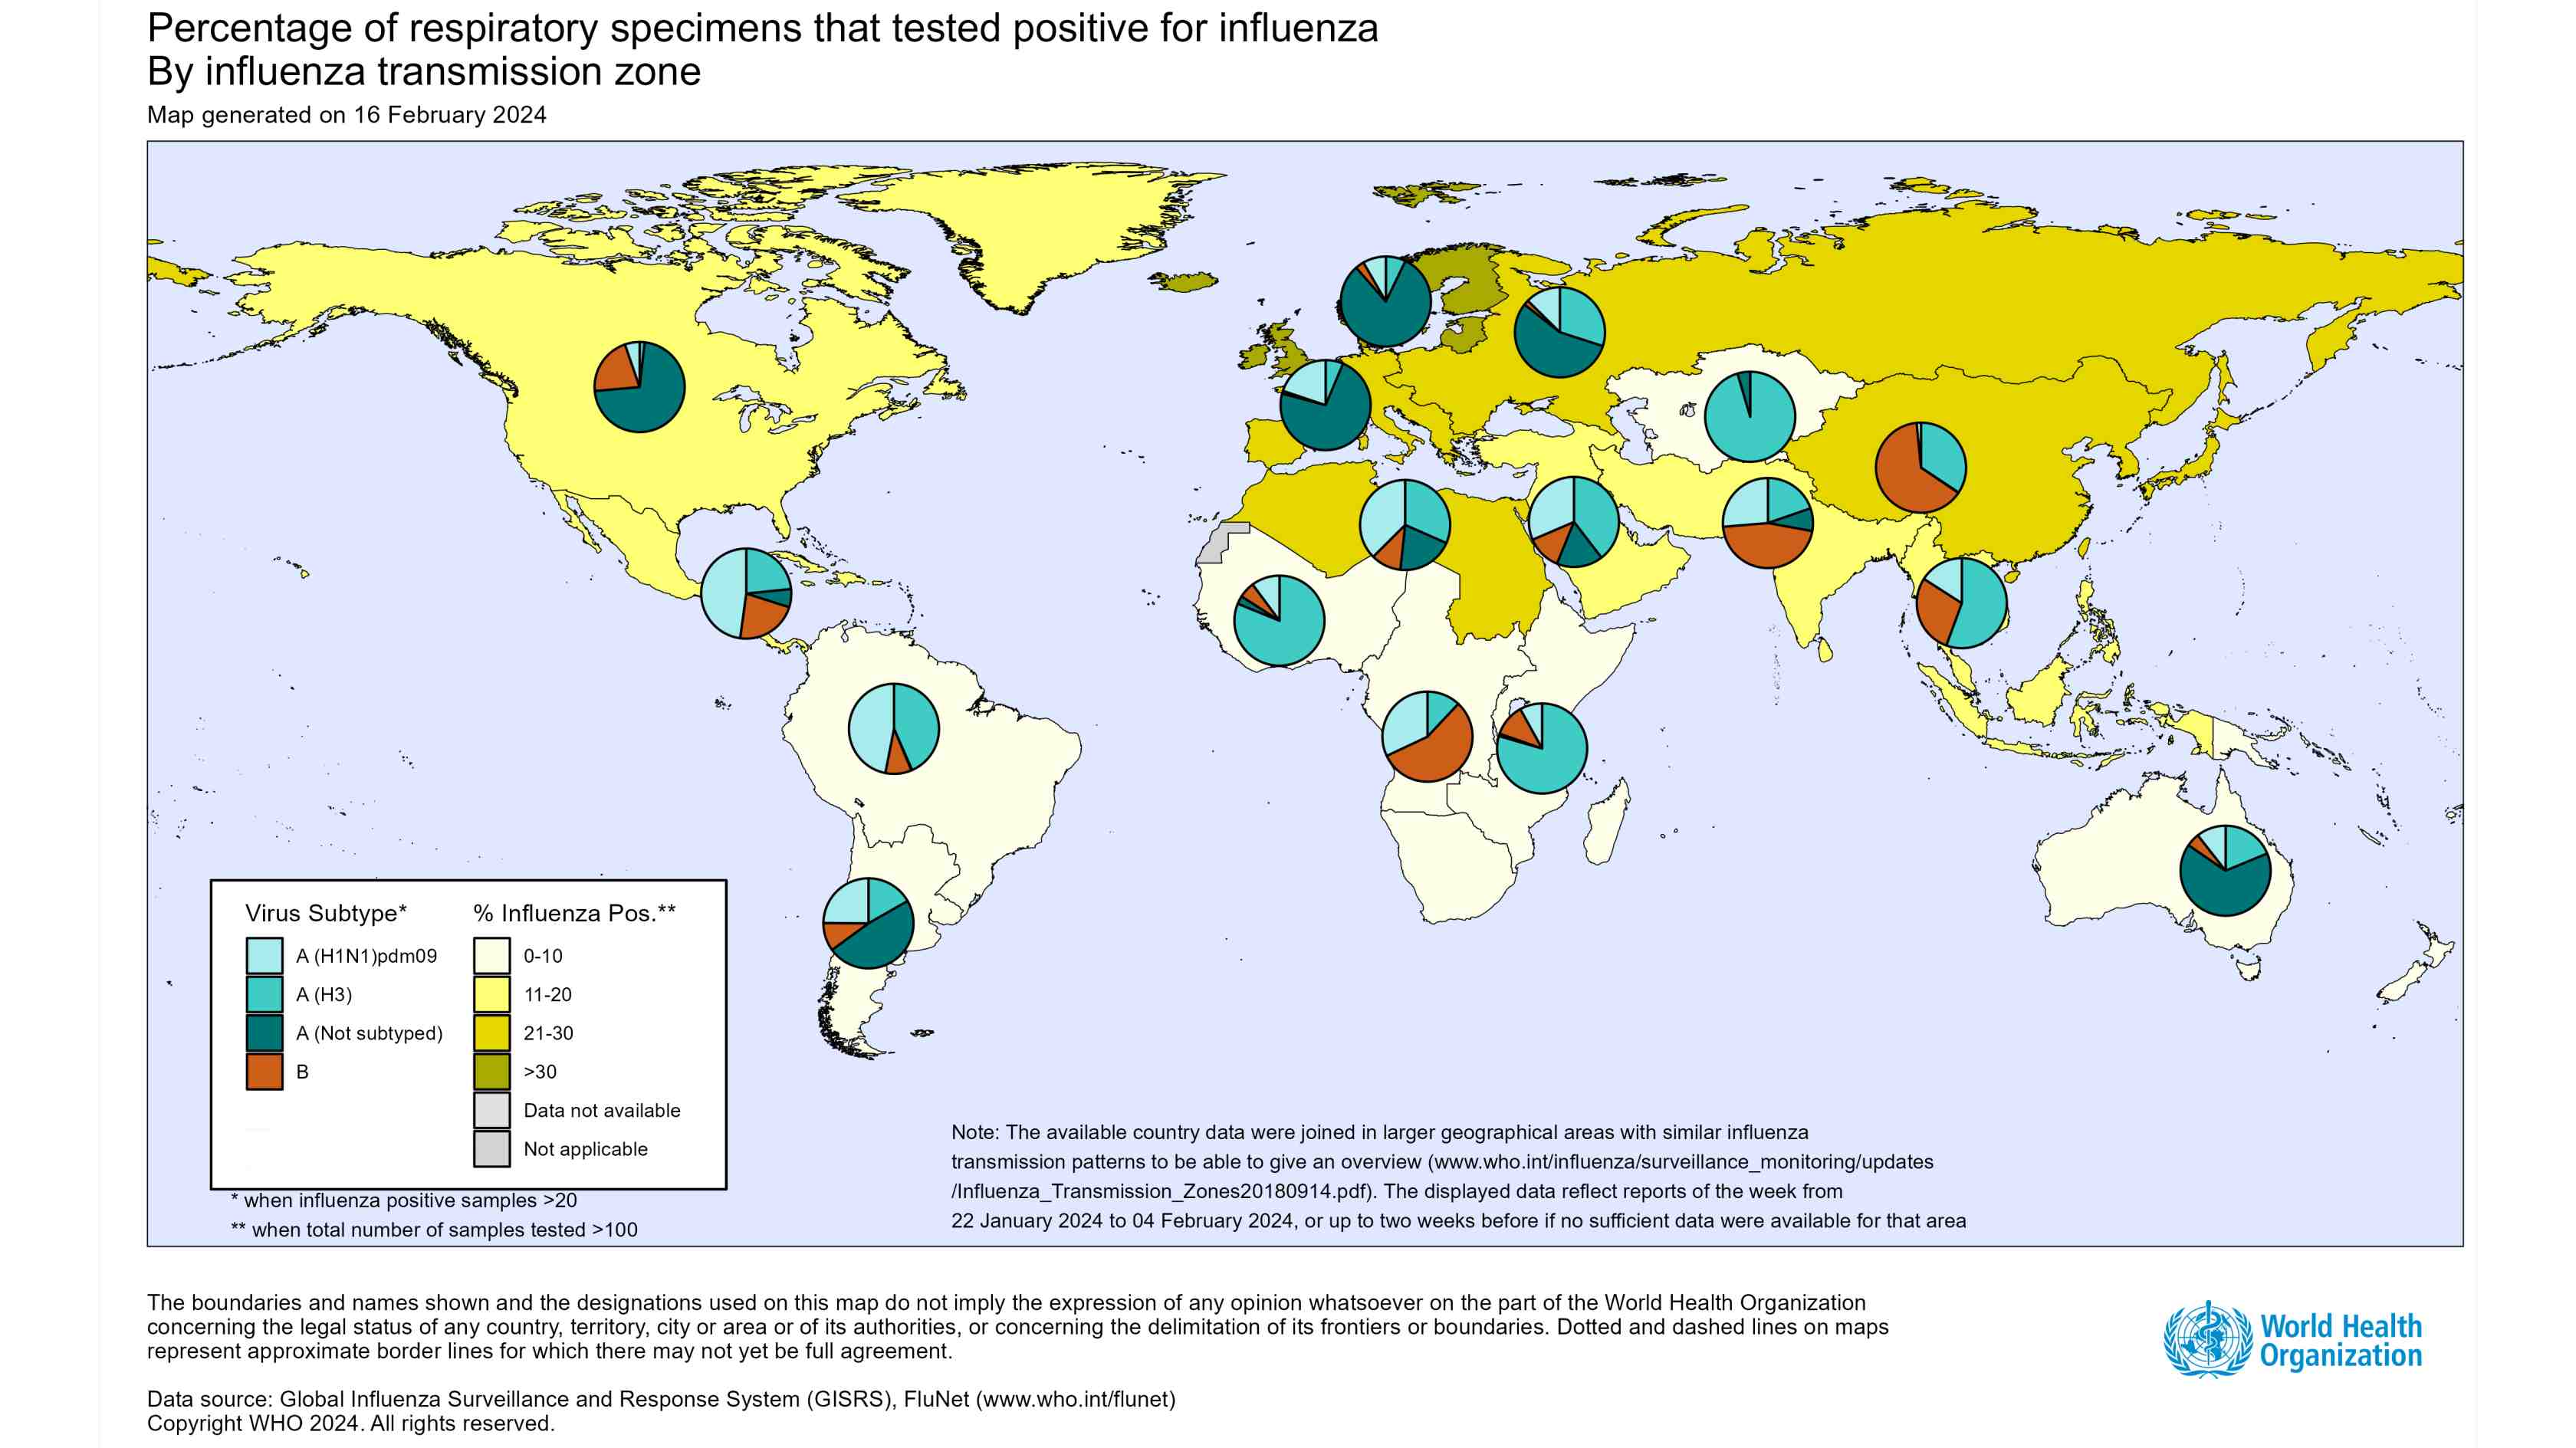
- Globally, influenza activity remained elevated in most Northern hemisphere countries, although global influenza virus detections decreased.
- In the countries of North America, influenza activity remained elevated but some indicators showed a decreasing trend. Influenza A(H1N1)pdm09 viruses predominated among the detections.
- In Europe and Central Asia, influenza activity remained elevated. Of thirty-five reporting countries, influenza activity was reported at very high intensity in two, high intensity in six, medium intensity in twenty, low intensity in six and below baseline in one, and geographic spread was widespread in majority of reporting countries. Influenza hospitalizations and intensive care unit (ICU) admissions remained elevated. Influenza A virus detections predominated among detections in primary and secondary care sentinel surveillance, with A(H1N1)pdm09 viruses predominant.
- In Northern Africa, detections of influenza A(H1N1)pdm09 and A(H3N2) continued to increase in Tunisia but decreased in the other countries.
- In Eastern Asia, influenza activity remained elevated but decreasing overall.
- In Western Asia, influenza activity decreased overall, although increased influenza A virus detections were reported in Armenia, Georgia, Israel and Türkiye.
- In the Central American and Caribbean countries, influenza activity remained elevated in sentinel surveillance but decreased in non-sentinel surveillance. Influenza A(H1N1)pdm09 viruses were predominant in the Caribbean followed by influenza A(H3N2) viruses, while influenza A(H1N1)pdm09 was predominant in Central America, followed by B/Victoria.
- In tropical South America, influenza activity remained low with few detections of influenza A viruses reported in some countries.
- In tropical Africa, influenza detections remained low in most reporting countries with a few exceptions and influenza A(H3N2) viruses predominated.
- In Southern Asia, overall influenza activity continued to decrease but remained elevated in some countries, with all seasonal influenza subtypes co-circulating.
- In South-East Asia, influenza activity driven by all seasonal subtypes increased in Malaysia and Singapore and remained elevated in Thailand.
- In the temperate zones of the southern hemisphere, indicators of influenza activity were reported at low levels or below the seasonal threshold in most reporting countries.
- National Influenza Centres (NICs) and other national influenza laboratories from 122 countries, areas or territories reported data to FluNet for the time period from 22 January 2024 to 04 February 2024* (data as of 16/02/2024 05:52:58 AM UTC). The WHO GISRS laboratories tested more than 581 499 specimens during that time period. 115 653 were positive for influenza viruses, of which 91 325 (78.96%) were typed as influenza A and 24 328 (21.04%) as influenza B. Of the sub-typed influenza A viruses, 9620 (45.15%) were influenza A(H1N1)pdm09 and 11 688 (54.85%) were influenza A(H3N2). Of the type B viruses for which lineage was determined, all (12 192) belonged to the B/Victoria lineage.
- Globally, SARS-CoV-2 positivity from sentinel surveillance remained below 10%. Positivity remained below 10% in all WHO Regions with exception of the Region of the Americas where positivity increased and was around 20%. SARS-CoV-2 positivity from non-sentinel surveillance decreased to around 10% globally.
- In countries with RSV surveillance in place, RSV activity was stable or decreased in most reporting countries except in the Russian Federation and South Africa, New South Wales of Australia where detections slightly increased in this reporting period though overall percentage positivity was still very low. RSV percent positivity was still high in Egypt though slightly dropped compared with last report.
- WHO encourages countries, especially those that have received the multiplex influenza and SARS-CoV-2 reagent kits from GISRS, to conduct integrated surveillance of influenza and SARS-CoV-2 and report epidemiological and laboratory information in a timely manner to established regional and global platforms. The guidance can be found here: https://www.who.int/publications/i/item/WHO-2019-nCoV-integrated_sentinel_surveillance-2022.1.
- National Influenza Centres (NICs) and other national influenza laboratories from 88 countries, areas or territories from six WHO regions (African Region: 12; Region of the Americas: 15; Eastern Mediterranean Region: 6; European Region: 42; South-East Asia Region: 8; Western Pacific Region: 5 ) reported to FluNet from sentinel surveillance sites for the time period from 22 January 2024 to 04 February 2024* (data as of 16/02/2024 05:52:58 AM UTC). The WHO GISRS laboratories tested more than 42 430 sentinel specimens during that time period and 3459 (8.15%) were positive for SARS-CoV-2. Additionally, more than 1 189 953 non-sentinel or undefined reporting source samples were tested in the same period and 108 442 were positive for SARS-CoV-2. Further details are included at the end of this update.
Source of data
______________________________________________________________________________________________
The Global Influenza Programme monitors influenza activity worldwide and publishes an update every two weeks. The updates are based on available epidemiological and virological data sources, including FluNet (reported by the WHO Global Influenza Surveillance and Response System), FluID (epidemiological data reported by national focal points) and influenza reports from WHO Regional Offices and Member States. Completeness can vary among updates due to availability and quality of data available at the time when the update is developed.
*It includes data only from countries reporting on positive and negative influenza specimens.