Influenza Update N° 382
Overview
07 December 2020, based on data up to 22 November 2020
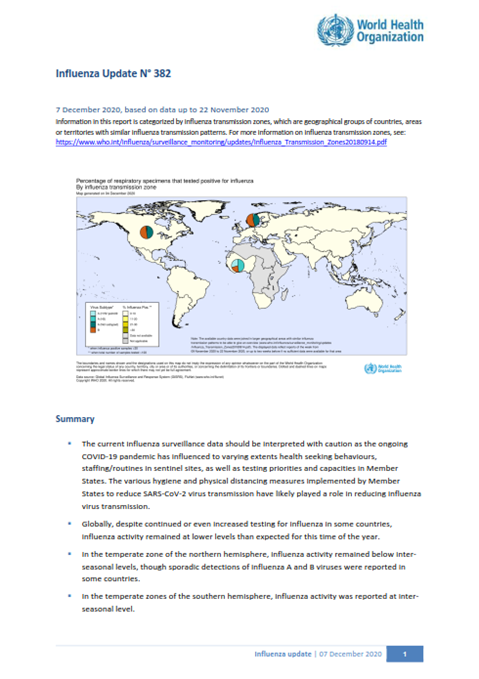
Information in this report is categorized by influenza transmission zones, which are geographical groups of countries, areas or territories with similar influenza transmission patterns. For more information on influenza transmission zones, see the link below:
Influenza Transmission Zones (pdf, 659kb)

- The current influenza surveillance data should be interpreted with caution as the ongoing COVID-19 pandemic has influenced to varying extents health seeking behaviours, staffing/routines in sentinel sites, as well as testing priorities and capacities in Member States. The various hygiene and physical distancing measures implemented by Member States to reduce SARS-CoV-2 virus transmission have likely played a role in reducing influenza virus transmission.
- Globally, despite continued or even increased testing for influenza in some countries, influenza activity remained at lower levels than expected for this time of the year.
- In the temperate zone of the northern hemisphere, influenza activity remained below inter-seasonal levels, though sporadic detections of influenza A and B viruses were reported in some countries.
- In the temperate zones of the southern hemisphere, influenza activity was reported at inter-seasonal level.
- In the Caribbean and Central American countries, sporadic influenza B detections were reported in some reporting countries. Severe acute respiratory infection (SARI) activity, likely due to COVID-19, continued to decrease in most reporting countries.
- In tropical South America, there were no influenza detections in this reporting period.
- In tropical Africa, influenza activity was reported in some countries of Western Africa.
- In Southern Asia, influenza detections continued to be reported in Afghanistan and India.
- In South East Asia, influenza detections of predominately influenza A(H3N2) continued to be reported in Cambodia, Lao People's Democratic Republic (PDR) and Thailand.
- Worldwide, influenza A and B viruses were detected in similar proportions.
National Influenza Centres (NICs) and other national influenza laboratories from 88 countries, areas or territories reported data to FluNet for the time period from 09 November 2020 to 22 November 2020 (data as of 2020-12-04 04:24:00 UTC). The WHO GISRS laboratories tested more than 192375 specimens during that time period. A total of 327 specimens were positive for influenza viruses, of which 162 (49.5%) were typed as influenza A and 165 (50.5%) as influenza B. Of the sub-typed influenza A viruses, 11 (20%) were influenza A(H1N1)pdm09 and 44 (80%) were influenza A(H3N2). Of the characterized B viruses, 2 (10.5%) belonged to the B-Yamagata lineage and 17 (89.5%) to the B-Victoria lineage.
During the COVID-19 pandemic, WHO encourages countries to continue routine influenza surveillance, test samples from influenza surveillance sites for influenza and SARS-CoV-2 viruses where resources are available and report epidemiological and laboratory information in a timely manner to established regional and global platforms. Updated considerations for addressing disruptions in the influenza sentinel surveillance and extending to include COVID-19 wherever possible are available in the interim guidance, Maintaining surveillance of influenza and monitoring SARS-CoV-2 – adapting Global Influenza surveillance and Response System (GISRS) and sentinel systems during the COVID-19 pandemic surveillance of influenza and monitoring SARS-CoV-2 – adapting Global Influenza surveillance and Response System (GISRS) and sentinel systems during the COVID-19 pandemic. Updated algorithms for testing of both influenza and SARS-CoV-2 for surveillance are also included.
Source of data
The Global Influenza Programme monitors influenza activity worldwide and publishes an update every two weeks. The updates are based on available epidemiological and virological data sources, including FluNet (reported by the WHO Global Influenza Surveillance and Response System), FluID (epidemiological data reported by national focal points) and influenza reports from WHO Regional Offices and Member States. Completeness can vary among updates due to availability and quality of data available at the time when the update is developed.
1It includes data only from countries reporting on positive and negative influenza specimens.