Influenza Update N° 422
Overview
27 June 2022, based on data up to 12 June 2022
Information in this report is categorized by influenza transmission zones, which are geographical groups of countries, areas or territories with similar influenza transmission patterns. For more information on influenza transmission zones, see the link below:
Influenza Transmission Zones (pdf, 659kb)
- The current influenza surveillance data should be interpreted with caution as the ongoing COVID-19 pandemic has influenced to varying extents health seeking behaviours, staffing/routines in sentinel sites, as well as testing priorities and capacities in Member States. Various hygiene and physical distancing measures implemented by Member States to reduce SARS-CoV-2 virus transmission have likely played a role in reducing influenza virus transmission.
- Countries are recommended to monitor the co-circulation of influenza and SARS-CoV-2 viruses. They are encouraged to enhance integrated surveillance and step-up their influenza vaccination campaign to prevent severe disease and hospitalizations associated with influenza. Clinicians should consider influenza in differential diagnosis, especially for high-risk groups for influenza, and test and treat according to national guidance.
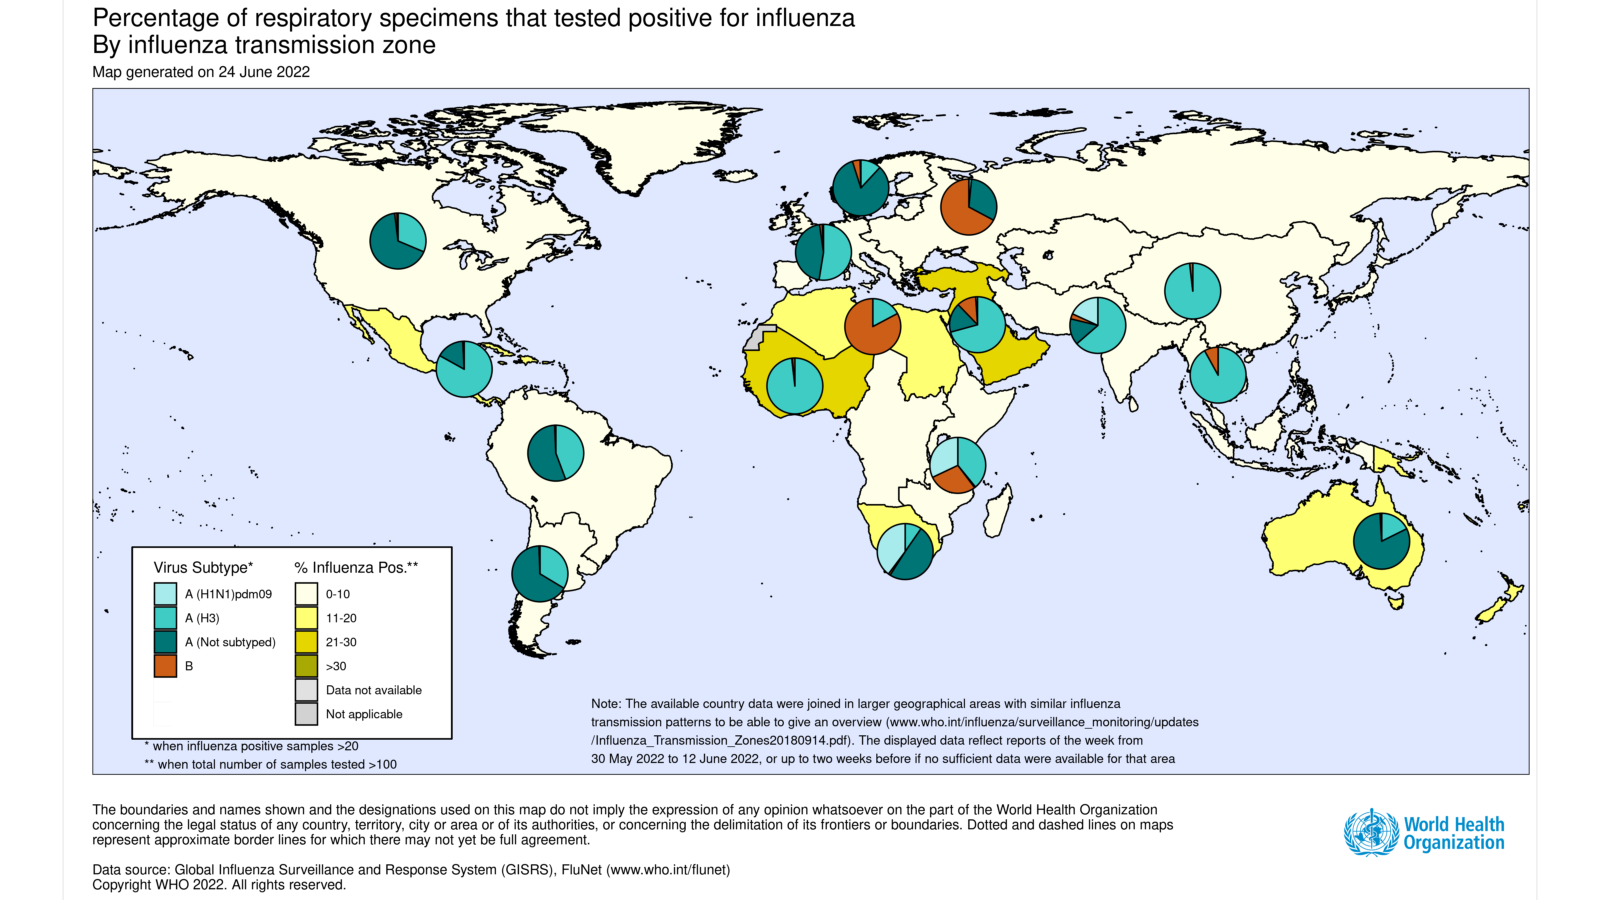
- Increasing activity in some areas of the temperate southern hemisphere has been reported, although global influenza activity continued to decrease following a peak in March 2022.
- In the temperate zones of the southern hemisphere, overall influenza activity increased in recent weeks, especially in Oceania and Southern Africa. In Oceania, influenza A detections continued to increase in some regions of Australia and in New Zealand.
- Influenza detections continued to increase in Southern Africa with the majority of detections reported as influenza A(H1N1)pdm09, followed by some influenza A(H3N2) and very few influenza B viruses.
- In temperate South America, influenza activity of predominately influenza A(H3N2) viruses decreased in Argentina, Paraguay and Uruguay, and increased in Chile.
- In the Caribbean and Central American countries, low influenza activity was reported with influenza A(H3N2) predominant.
- In tropical South America, low influenza activity was reported with influenza A(H3N2) most frequently detected followed by few influenza B viruses.
- In tropical Africa, influenza activity remained low with influenza A(H3N2) predominant.
- In Southern and South-East Asia, influenza virus detections were at low levels overall.
- In the countries of North America, influenza activity continued to decrease compared to the previous period and influenza positivity was higher than usual for this time of year. Activity was predominantly due to influenza A viruses, with A(H3N2) predominant among the subtyped viruses. RSV activity remained low in Canada and the United States of America (USA).
- In Europe, overall influenza activity continues to decline with influenza A(H3N2) predominant among the subtyped viruses.
- In Central Asia, no influenza detections were reported.
- In Northern Africa, no influenza detections were reported.
- In East Asia, influenza activity of predominantly influenza A(H3N2) and influenza-like illness (ILI) activity increased in the southern provinces of China. Respiratory illness indicators remained elevated in Mongolia, though influenza detections were low. Elsewhere, influenza illness indicators and activity remained low.
- In Western Asia, influenza A(H3N2) was most frequently detected among reporting countries.
- National Influenza Centres (NICs) and other national influenza laboratories from 107 countries, areas or territories reported data to FluNet for the time period from 30 May 2022 to 12 June 2022* (data as of 2022-06-24 07:06:19 UTC). The WHO GISRS laboratories tested more than 161 959 specimens during that time period. 9069 were positive for influenza viruses, of which 8839 (97.5%) were typed as influenza A and 230 (2.5%) as influenza B. Of the sub-typed influenza A viruses, 97 (2.3%) were influenza A(H1N1)pdm09 and 4203 (97.7%) were influenza A(H3N2). Of the characterized B viruses, 3 (6.5%) belonged to the B-Yamagata lineage and 43 (93.5%) to the B-Victoria lineage.
During the COVID-19 pandemic, WHO encourages countries, especially those that have received the multiplex influenza and SARS-CoV-2 reagent kits from GISRS, to conduct integrated surveillance of influenza and SARS-CoV-2 and report epidemiological and laboratory information in a timely manner to established regional and global platforms. Revised interim guidance has just been published here: https://www.who.int/publications/i/item/WHO-2019-nCoV-integrated_sentinel_surveillance-2022.1.
- Overall COVID-19 positivity from sentinel surveillance increased during the reporting period to approximately 30%. The greatest increases were observed in the Region of the Americas and the Western Pacific Region of WHO where positivity was around 30% and 20%, respectively. In the other Regions of WHO positivity was around or below 15%. Activity from non-sentinel sites was varied, with overall positivity around 20%.
- National Influenza Centres (NICs) and other national influenza laboratories from 41 countries, areas or territories reported data to FluNet for the time period from six WHO regions (African Region: 1; Region of the Americas: 16; Eastern Mediterranean Region: 2; European Region: 15; South-East Asia Region: 4; Western Pacific Region: 3) reported to FluNet from sentinel surveillance sites for time period from 30 May 2022 to 12 Jun 2022* (data as of 2022-06-24 07:06:19 UTC). The WHO GISRS laboratories tested more than 44 602 sentinel specimens during that time period and 12 008 (26.9%) were positive for SARS-CoV-2. Additionally, more than 687 614 non-sentinel or undefined reporting source samples were tested in the same period and 137 687 were positive for SARS-CoV-2. Further details are included at the end of this update and in the surveillance outputs here.
Source of data
______________________________________________________________________________________________
The Global Influenza Programme monitors influenza activity worldwide and publishes an update every two weeks. The updates are based on available epidemiological and virological data sources, including FluNet (reported by the WHO Global Influenza Surveillance and Response System), FluID (epidemiological data reported by national focal points) and influenza reports from WHO Regional Offices and Member States. Completeness can vary among updates due to availability and quality of data available at the time when the update is developed.
*It includes data only from countries reporting on positive and negative influenza specimens.