Gross domestic R&D expenditure on health (health GERD) as a % of gross domestic product (GDP)
The gross domestic expenditure on R&D in the health and medical sciences (health GERD) are collected from the United Nations Educational, Scientific and Cultural Organization (UNESCO), the Organisation for Economic Co-operation and Development (OECD) and Eurostat, the statistical office of the European Union. The gross domestic product (GDP) data are collected from the World Bank. Data on this indicator are reported using the most recent available data since 2010 by country (Note: not all countries have reported data on this indicator).
See also:
What you see
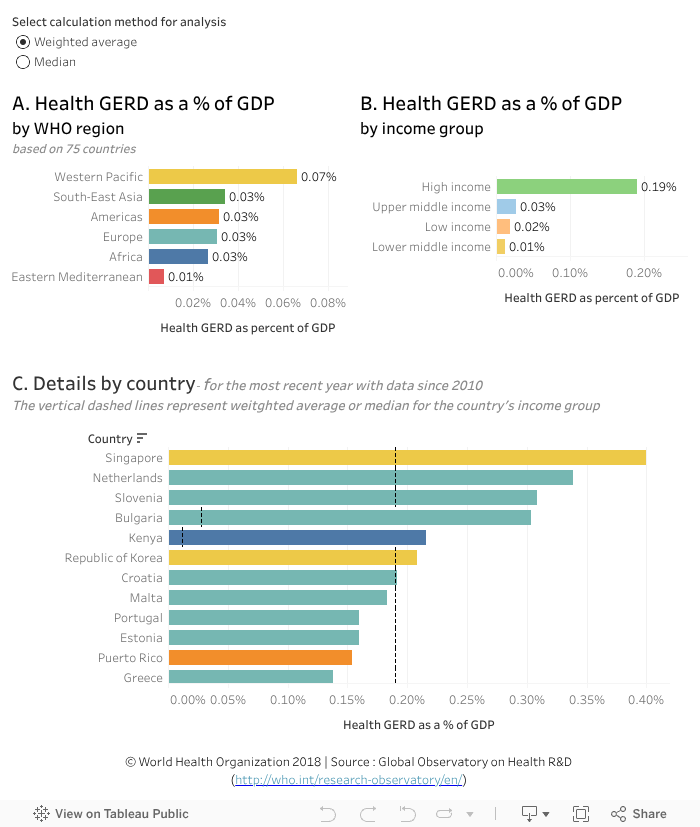
The data visualization compares health GERD by country as a % of GDP. Regional weighted averages and medians are provided by WHO region and country income groups (top charts).
Points to note:
- The weighted regional averages and median are derived from the 75 Member States for which data are available. They need to be interpreted cautiously because of the number of missing observations.
- The regional average health GERD as a % of GDP ranged from 0.01% to 0.07% for the reported period and countries . (Chart A).
- The average health GERD as a % of GDP was substantially higher in high income countries (0.19%) than other income groupings (Chart B).
To explore by country estimates and differences with regional averages (the income group average is symbolized by vertical dashed line):
- Select a region and/or income group in the top charts to filter countries according to those categories.
-- For example, clicking on the Eastern Mediterranean group (Chart A), shows that Qatar allocated 0.10% of its GDP to health GERD in the reported year; 10 times the regional average (0.01%). - To see countries belonging to a particular income group within a region: after selecting a region (Chart A), select an income group (Chart B) which will filter the countries belonging to this income group within this region.
-- For example, selecting the low income group within Africa shows that the health GERD as a % of GDP are all above the income group average (see vertical dashed line at the 0.02% mark in the bottom chart) for the countries with data in this income group and region, except for Burkina Faso and Madagascar. - Hover the cursor on a bar in a graphic to see more information in a popup window (year, total GERD in local currency, health GERD in local currency (with health GERD as % of GDP), GDP, regional/income level averages).
- Undo a selection by clicking ‘undo’ or ‘reset’ near the bottom of the visualization or by clicking the same element again.