Official development assistance (ODA) for medical research and basic health sectors as a % of gross national income (GNI) and as a % of all ODA, by donor country
Published: March 2025, data up to 2023
Data on the official development assistance (ODA) for medical research and basic health sectors (health ODA) and ODA as % of gross national income (ODA as % GNI) are collected from the Organization for Economic Co-operation and Development (OECD) and are reported for the year 2023 by donor country (not all countries have reported data on this indicator)
See also:
What you see
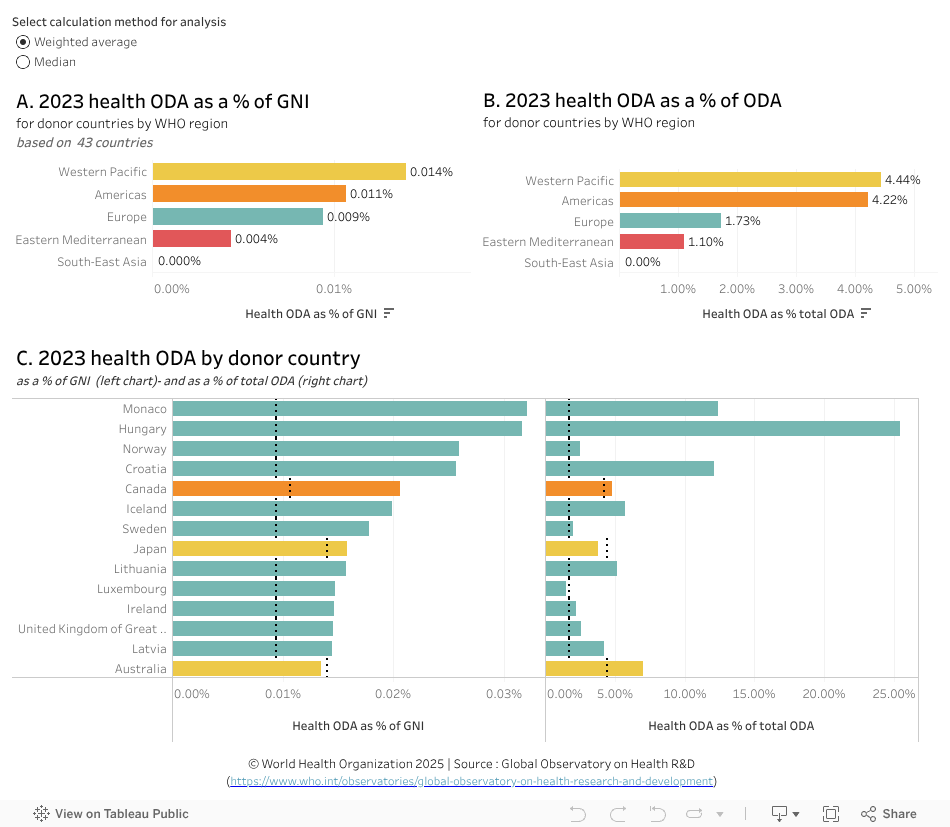
The data visualization compares 2023 medical research and health ODA by donor country as a % of GNI (chart C, left) and as a % of total ODA (chart C, right). The regional weighted averages and medians are provided in chart A and chart B.
Points to note:
- The information about health ODA is derived from 43 Member States for which data are available.
- The Western Pacific region has the highest weighted average of health ODA as a % of GNI followed by the Americas region (0.014% and 0.011% respectively; chart A), a change and significant decrease from 2021 when Eastern Mediterranean and European regions had the highest weighted average of health ODA as a % of GNI (0.039% and 0.029% respectively).
- Hungary and Kuwait prioritize spending on medical research and basic health with around 1/4 of their total ODA being spent on health, totaling 67 million USD (sort C, right hand graph. Hover over country bar to see actual amounts in Million USD)
- The countries spending the most ODA on health and medical research in 2023 are the United States of America (2,671 million USD), Japan and Germany (704 and 595 million USD respectively).
To explore by country estimates and compare with regional averages (the regional weighted average is symbolized by a vertical dashed line)
- Select a region in chart A or chart B to filter countries according to those categories and then examine the data in chart C. For example:
--Selecting only the region of the Western Pacific (in either chart A or chart B), shows that Australia and Republic of Korea exceeded the regional weighted average for health ODA as a % of total ODA (Australia: 7% down from 15%; 6%: Chart C), but not health ODA as a % of GNI (both 0.01%).
--Selecting only Europe (in either chart A or chart B, shows that of the countries exceeding the regional weighted average of 0.009% for health ODA as % of GNI (chart C, left), Monaco allocated the highest share of health ODA as a % of GNI (0.03%). This is approximately one third than the highest in 2021 data (Norway; 0.08%), and is three times the regional weighted average and six times the median (0.005%). Hungary had the highest health ODA as % of total ODA (25%; chart C, right). - Hover the cursor on a bar in a graphic to see more information in a popup window.
- Undo the selection by clicking ‘undo’ or ‘reset’ near the bottom of the page or by clicking the same element again.
Previous versions
March 2023 | April 2022 | February 2021 | April 2020 | January 2019 | January 2018 | January 2017