Number of clinical trial registrations by year, location, disease and phase of development (1999-2016)
Published: April 2017
The number of trials listed in the WHO International Clinical Trials Registry Platform (ICTRP) is reported by year, location (worldwide, WHO region and country), disease (or condition) and phase of development, for the period 1999–2016. Note that the ICTRP comprises both interventional and observational trials. See more on scope of ICTRP below.
See also:
What you see | Scope and limitations | Data sources | Current version
What you see
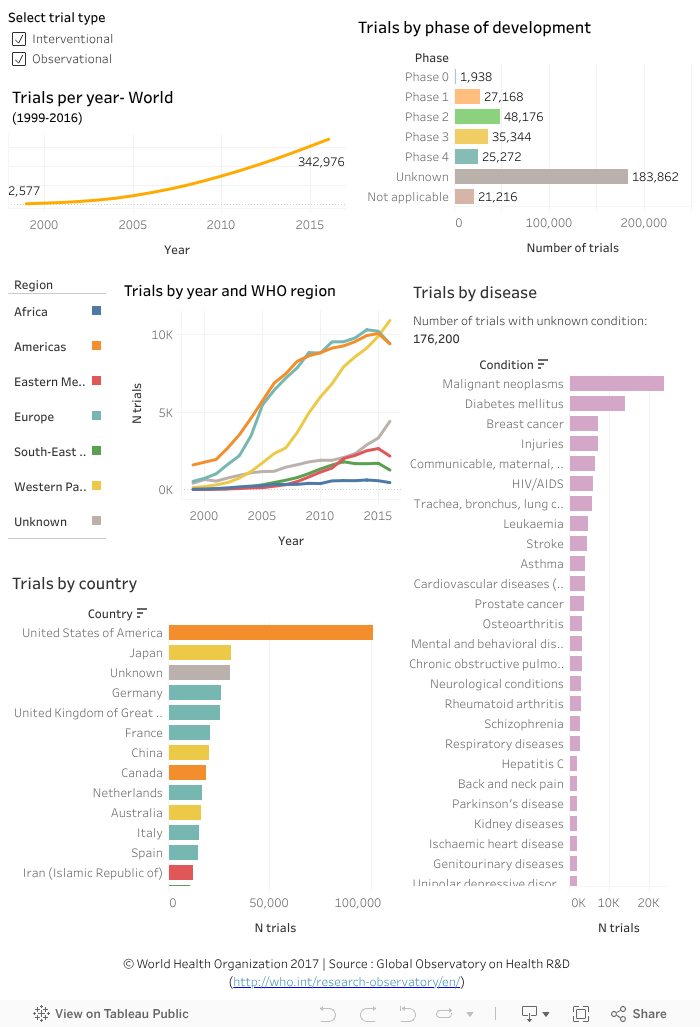
The data visualization above shows trials on ICTRP from 1999 to 2016 as follows:
- Trials by year worldwide (top left chart).
- Trials by year and WHO region (middle left chart).
- Trials by country (bottom left chart), colour coded by WHO region.
- The phase of development for each trial (top right chart).
- Trials by disease or condition (bottom right chart).
The top left chart show the total number of trials, regardless of the number of trial sites involved. A multicountry trial is counted once for each participating region in the middle left chart and once in each participating country in the bottom chart. The default for the two charts on the right is one trial counted once regardless of the number of sites. When a selection is made, either by filtering a region or country, the count will reflect the same principle described above. The year corresponds to the date of enrolment of the first trial participant.
Points to note:
- The United States of America has the highest total trial registrations during 1999-2016 (101,106), followed by Japan (31,030).
- Trials of unknown location are third on the country list with a total of 30,487 trials (0.08%) with no information on the trial site.
- Of interventional trials (tick the box on the top left to filter), 57% (183,862) have no information on the phase of development (top right). Of those with an identified phase of development, the largest proportion of trials is in phase II (48,176).
- ICTRP and its underlying sources do not include a field describing the disease or condition investigated in each trial. Data mining techniques were, therefore, used to assign a primary disease to each trial (see approach under analysis below). It was not possible to match 176,200 trials (51%) to any disease. For some trials, it was only possible to classify them into broader categories such as communicable, maternal, perinatal and nutritional conditions.
- Of those trials with a known disease, the top four are malignant neoplasms (23,881), diabetes mellitus (14,031), breast cancer (7,342) and injuries (7,260).
To explore the data further:
- Tick the box (top left) to filter the results for only interventional or observational trials.
- To filter the results for one or a combination of the following: year, region, country, disease or phase, click on the relevant data element (for example on a region from the key in the middle left chart; a point on the trend line for the year; or a bar beside the desired disease, phase or country) in the relevant charts.
-- For any of the above selections, information in the other charts will update accordingly, as relevant. - Hover the cursor on a data element of interest (for example a bar or a point on a trend line) to see more information in a popup window.
- Hold the ctrl key to select more than one option, for example two regions.
- Undo a selection by clicking ‘undo’ or ‘reset’ near the bottom of the page or by clicking the same element again.
Limitations of the data and analysis
- There are several gaps in the ICTRP data source, which required data cleaning to uniformly classify data elements when possible. In some cases no information was available, e.g. on the country where the trial is conducted (0.08%) or the phase of development of clinical trials (57%).
- Automated data mining was used to generate information on the primary disease investigated in each trial using text-based data fields.
-- A list of disease synonyms was compiled using as a base the Unified Medical Language System (UMLS). This was complemented by synonyms drawn from the data, mostly to account for errors in data entry such as spelling errors or use of abbreviations.
-- An automated algorithm was applied to two data fields using the list of disease synonyms to generate the uniform disease classification field used in this analysis. The first field is a based on free-text keywords provided by the registrant. The second is the scientific title of the trial. If the first field provided a match the second was not used.
-- The first match closer to the beginning of the text field was selected. This was considered the primary disease investigated by the trial. It is possible that the trial has more than one disease focus, which is not captured in this analysis.
-- The algorithm was refined through various iterations but as with any automated algorithm, it is likely that some trials were not correctly matched.
-- This method resulted in matching 49% of the trials to a disease. Information on the diseases presented above are therefore not representative of all trials on the ICTRP and must be interpreted with caution. - The data presented in this visualization utilizes classifications that are not mutually exclusive. For example, a registered trial can recruit participants from multiple countries and regions. In this case, the trial will be counted once per region in the middle left chart but once per country in the bottom left chart. The total number of trials across the two charts is therefore not equivalent.
- The analysis will be updated at regular time points but time lags with the scheduled updates by the data sources are inevitable. Accuracy and completeness of the information is the responsibility of the data source, see terms and conditions of use.