Trends and volume of peer-reviewed publications for neglected diseases and R&D Blueprint pathogens
Published: January 2017
The total number of peer-reviewed publications by disease, year, country of corresponding author and authors with the highest number of publications was retrieved using the Go PubMed search engine for the years 1960-2016. The analysis was performed for 36 diseases – those covered in the WHO list of neglected tropical diseases and R&D Blueprint pathogens, plus malaria, tuberculosis and HIV/AIDS.
What you see
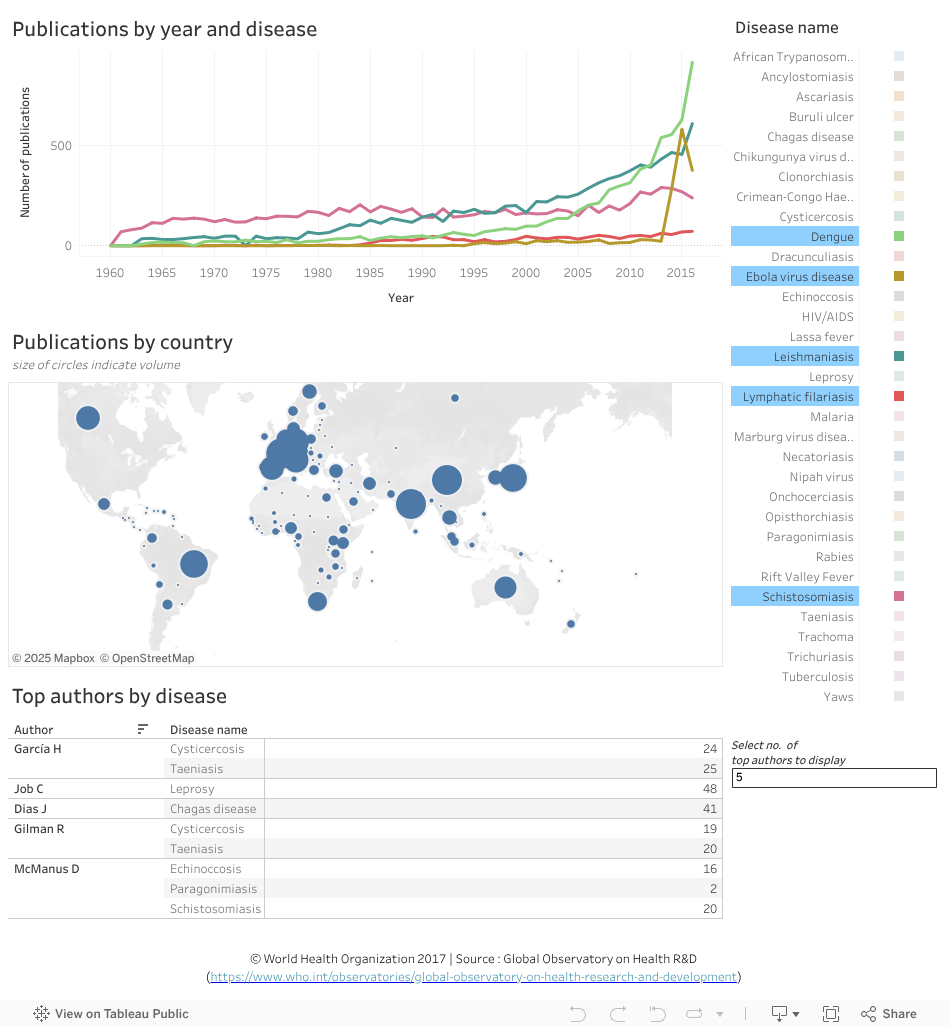
The data visualization illustrates publications trends by year and disease (top chart), the country of corresponding author (map), and the top authors with publications by disease (bottom table). The following five diseases have been selected for illustration: dengue; Ebola virus disease; leishmaniasis; lymphatic filariasis; schistosomiasis (data can be explored for other diseases as desired). To explore data for other diseases, select the disease from the key at the top right. To explore multiple diseases, use the ctrl key when making the selection.
Points to note:
- The combined chart of five diseases illustrates that there is substantial variation in both the number of publications at any point in time and the publication trend for the different diseases.
- For some of the diseases in recent years there are orders of magnitude differences in the number of publications.
-- For example, in 2015 there were 5 987 publications for HIV/AIDS, 2 862 publications for tuberculosis and 1 525 publications for malaria, compared with only 69 publications for lymphatic filariasis (hover on a time point in the line representing a disease to see more information in a popup.) - For some diseases (e.g. dengue, tuberculosis, rabies) there is a noticeable increase in publication outputs commencing during the period 1990–2000.
Exploring specific diseases:
- Selecting HIV/AIDS, shows an apparent steep increase in publications between 2015 and 2016 compared to previous years.
- Selecting tuberculosis, the number of publications per year increased by almost three fold between 2000 and 2016 (i.e. from 1 316 in 2000 to 3 616 in 2016).
- Selecting trichuriasis, in comparison, shows no increasing trend in recent years. In fact the maximum number of publications in one year for this diseases was 31 (for 1973), with an average of around 15 publications per year for the entire period shown. In 2016 there were only 9 publications worldwide.
- Selecting Ebola virus disease shows a dramatic increase in the two year period 2013–2015 – from 22 publications in 2013 to 583 in 2015 (a 26 times fold increase). However, there is also a decline in 2016.
To explore the data further
- Hover the cursor on a country on the map to see the number of publications on the 36 diseases; the bigger the size of the circles the higher the publication output.
- Consult the table to see the top authors for the selected diseases. Five are selected by default but other values can be selected up to 50.
- Click ‘undo’ or ‘reset’ near the bottom of the page or click the same element again to undo a selection.