5.1 Universal Health Coverage and TB
Universal health coverage (UHC) means that everyone can obtain the health services they need without suffering financial hardship (1). Target 3.8 of the United Nations (UN) Sustainable Development Goals (SDGs) is to achieve UHC by 2030 (2). The milestones and targets for reductions in tuberculosis (TB) incidence and TB mortality set in the World Health Organization (WHO) End TB Strategy can only be achieved if everyone who develops TB disease can access high-quality treatment.
The SDGs include two UHC indicators: (i) a health service coverage index (SCI); and (ii) the proportion of the population with large household expenditures on health as a share of total household income or expenditure.
Estimates of the SCI at global, regional and country levels are currently available for 2000–2021 (1, 3). Worldwide, there were steady improvements in the SCI between 2000 and 2019, from a score of 45 (out of 100) in 2000 to 68 in 2019 (Fig. 5.1.1a). Most of this progress occurred between 2000 and 2015 and was primarily due to improvements in service coverage for infectious diseases (with only limited changes for other areas of service provision). At regional level, the SCI increased in all six WHO regions between 2000 and 2019; the biggest gains were in the South-East Asia and Western Pacific regions (Fig. 5.1.1a). There were also increases in all four World Bank income groups (Fig. 5.1.1b). In 2020 and 2021, during the COVID-19 pandemic, progress stalled globally (at a value of 68 in 2021) and in most WHO regions and World Bank income groups. In 2021, the WHO regions with the highest values were the European Region (81) and the Region of the Americas (80); the African Region had the lowest value (44).
Among the 30 high TB burden countries, most made progress between 2000 and 2019 (Fig. 5.1.2). The largest gains in absolute terms (+30 index point or more) were in China, India, Myanmar, Thailand and Viet Nam. During the COVID-19 pandemic, progress stalled or reversed in most countries. In 2021, the countries with the highest SCI values (around 80) were Brazil, China and Thailand; most other countries had values between around 40 and 60.
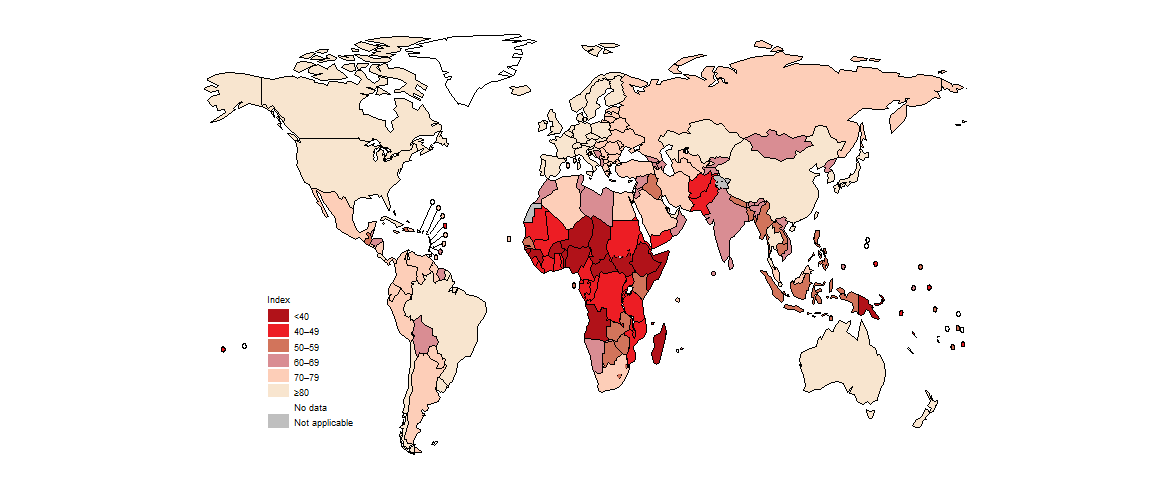
Across all countries, there was a great deal of variation in the SCI in 2021 (Fig. 5.1.3). The highest values were in high-income countries in North America, western Europe and parts of the Western Pacific Region; the lowest values were predominantly in countries in the WHO African Region.

In contrast to improvements in the SCI, the global level of financial protection for health expenditures worsened between 2010 and 2019 (estimates for later years are not currently available). Worldwide, the proportion of the general population facing catastrophic expenditure on health (using a threshold of >10% annual household income or expenditure) rose from 11.4% (794 million people) in 2010 to 13.5% (1.04 billion people) in 2019 (1, 3). At regional level, higher proportions in 2019 compared with 2010 were estimated for all WHO regions except the Region of the Americas (Fig. 5.1.4) (3).
Source: Global Health Observatory (https://www.who.int/data/gho)
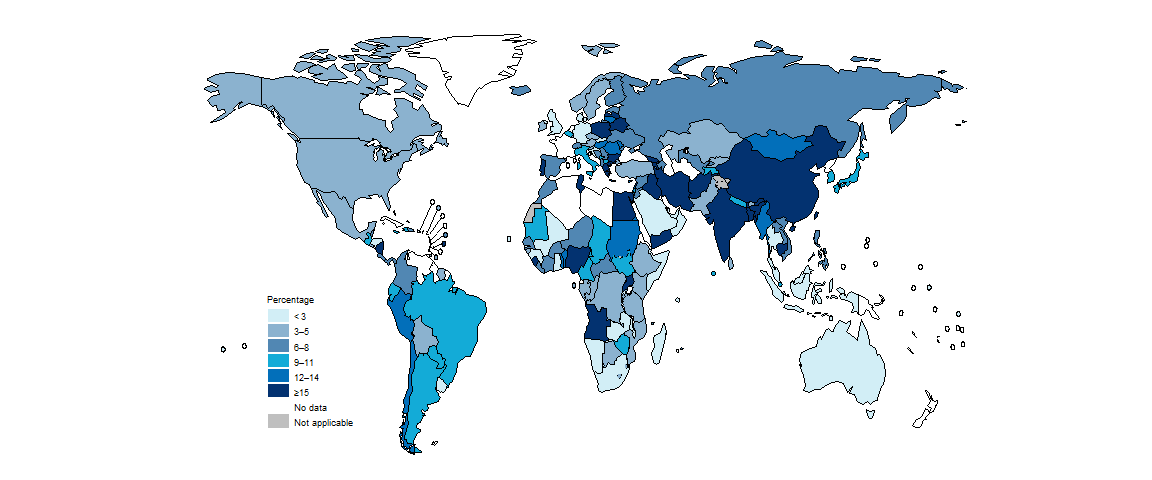
National values are available for different years and there is more geographical variability compared with the SCI, including within regions (Fig. 5.1.5). Of the 30 high TB burden countries, seven had particularly high levels of catastrophic health expenditure (≥15%): Angola, Bangladesh, China, India, Nigeria, Sierra Leone and Uganda.

b The latest available year ranges from 1995 to 2021.
Source: Global Health Observatory (https://www.who.int/data/gho)
The distribution of the two UHC indicators in the 30 high TB burden countries shows that, in general, values improve with income level; this is especially evident for the SCI (Fig. 5.1.6). Nonetheless, as also illustrated in Fig. 5.1.5, the risk of catastrophic health expenditure is high (15% or above) in several middle-income countries, including Angola, Bangladesh, China, India, and Nigeria. Thailand stands out as a high TB burden country with both a high SCI (80 or above) and a high level of financial protection (2% of households facing catastrophic health expenditure). A UHC scheme was established in 2002, supported by domestic funding and a strong primary health care system (4).
b Defined as ≥10% of total household consumption or income. The latest available year ranges from 2007 to 2021 for the 30 high TB burden countries.
c Data were not available for Democratic People’s Republic of Korea and Papua New Guinea.
d The classification is for the latest year for which data for SDG 3.8.2 are available.
Source: Global Health Observatory (https://www.who.int/data/gho)
To achieve UHC, substantial increases in investment in health care are critical. From 2000 to 2020, there were striking increases in health expenditure (from all sources) per capita in a small number of high TB burden countries, notably the upper-middle-income countries of Brazil, China, South Africa and Thailand (Fig. 5.1.7). A steady upward trend was evident in Bangladesh, Ethiopia, India, Indonesia, Lesotho, Mongolia, Mozambique, the Philippines and Viet Nam, and there was a noticeable rise from 2012 to 2017 in Myanmar. Elsewhere, however, levels of spending have been relatively stable, and at generally much lower levels.
(a) Low-income countries
(b) Lower-middle-income countries
(c) Upper-middle-income countries
Source: WHO Global Health Expenditure Database (http://apps.who.int/nha/database/)
References
World Health Organization/World Bank. Tracking Universal Health Coverage: 2023 Global monitoring report. Geneva: World Health Organization; 2023 (https://www.who.int/publications/i/item/9789240080379).
Sustainable development goals: Goal 3 targets and indicators [website]. New York: United Nations (https://sdgs.un.org/goals/goal3#targets_and_indicators).
Global Health Observatory (https://www.who.int/data/gho).
Tangcharoensathien V, Witthayapipopsakul W, Panichkriangkrai W, Patcharanarumol W, Mills A. Health systems development in Thailand: a solid platform for successful implementation of universal health coverage. Lancet. 2018;391(10126):1205–23 (https://pubmed.ncbi.nlm.nih.gov/29397200/).
