
5.3 TB determinants
The tuberculosis (TB) epidemic is strongly influenced by broader social and economic development as well as (often interrelated) risk factors more specially linked to health, such as alcohol use disorders, diabetes, HIV infection, smoking and smoking and undernourishment. For example, the numbers of people developing TB and dying from the disease started to decline in western Europe, North America and some other parts of the world around the turn of the 20th century, as incomes grew, levels of poverty fell, and housing and nutrition improved (1, 2). The fastest declines in TB incidence and TB mortality in western Europe occurred in the 1950s and 1960s, in the context of progress towards universal health coverage (UHC), rapid social and economic development, and the availability of effective drug treatments.
Achieving global targets for reductions in TB disease burden set in the United Nations (UN) Sustainable Development Goals (SDGs) and World Health Organization (WHO) End TB Strategy requires progress in addressing TB determinants. For this reason, WHO has developed a framework for monitoring SDG indicators related to TB; this comprises 14 indicators for which a relationship with TB incidence could be established, under seven SDGs (see Annex 6 of the main report). Five are health-related risk factors for TB and six are broader socioeconomic determinants; the other three indicators, two for UHC and one related to current health expenditures, are covered in Section 5.1.
There is a particularly clear relationship between TB incidence and two SDG indicators: (i) the population prevalence of undernourishment and (ii) gross domestic product (GDP) per capita (Fig. 5.3.1).
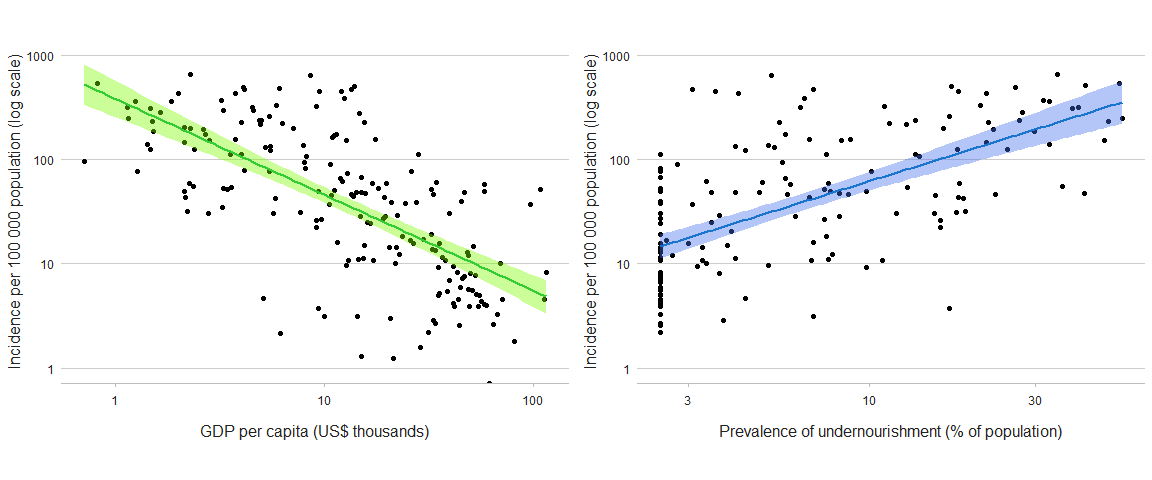
b The year of data used for GDP per capita and the population prevalence of undernourishment is the latest year for which data are available in the World Bank (https://data.worldbank.org/) and SDG (https://unstats.un.org/sdgs/dataportal) databases, respectively.
Estimates of the number of incident cases of TB attributable to alcohol use disorders, diabetes, HIV infection, smoking and undernourishment are shown in Fig. 5.3.2. Globally in 2022, an estimated 2.2 million incident cases of TB were attributable to undernourishment, 0.89 million to HIV infection, 0.73 million to alcohol use disorders, 0.70 million to smoking and 0.37 million to diabetes (Fig. 5.3.2).
At country level, there is considerable variation in the relative importance and contribution of the five health-related risk factors (Fig. 5.3.3, Fig. 5.3.4), and thus also variation in which of these factors need to be prioritized as part of national efforts to reduce the burden of TB disease.
(a) Undernourishmentb
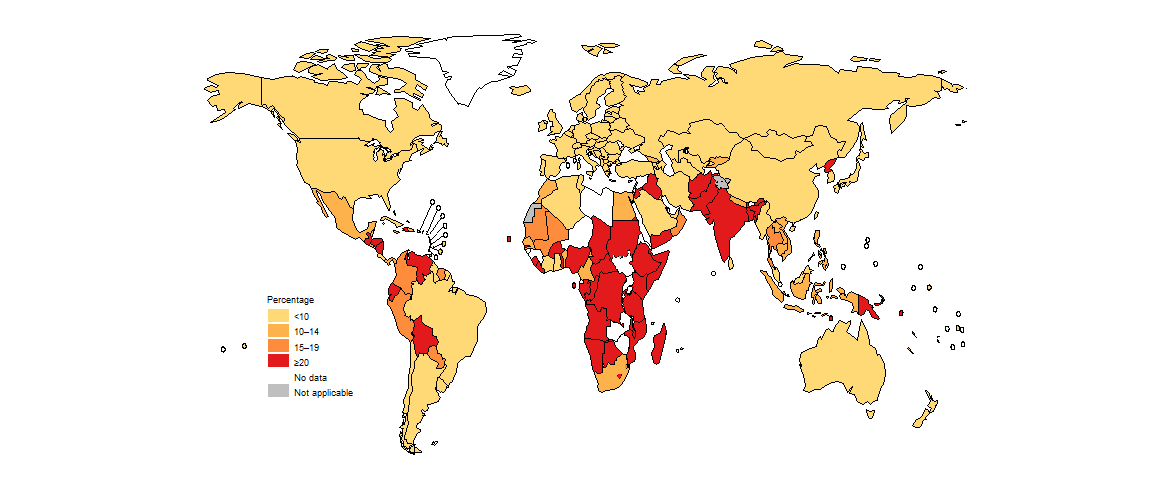
(b) Alcohol use disorders
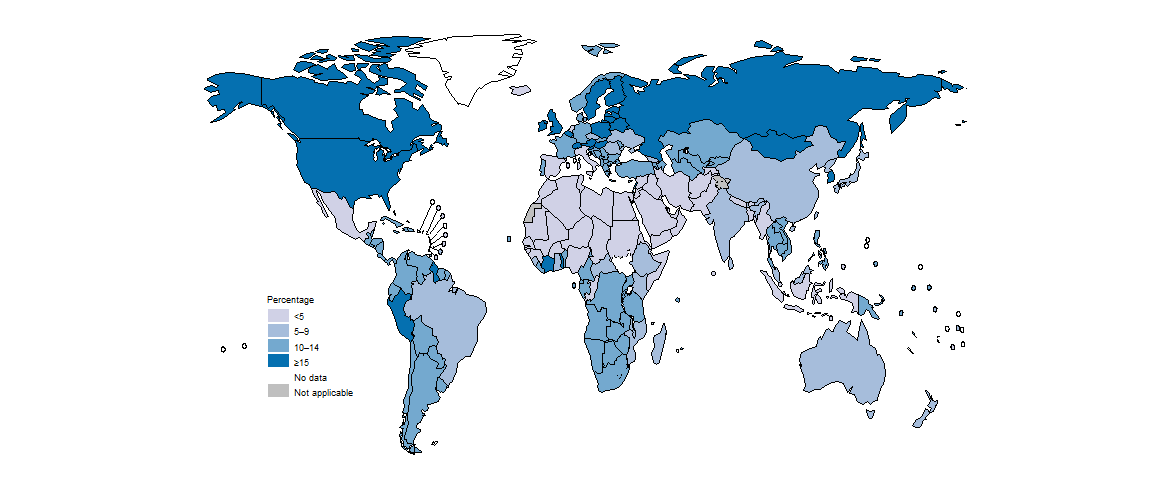
(c) HIV infection
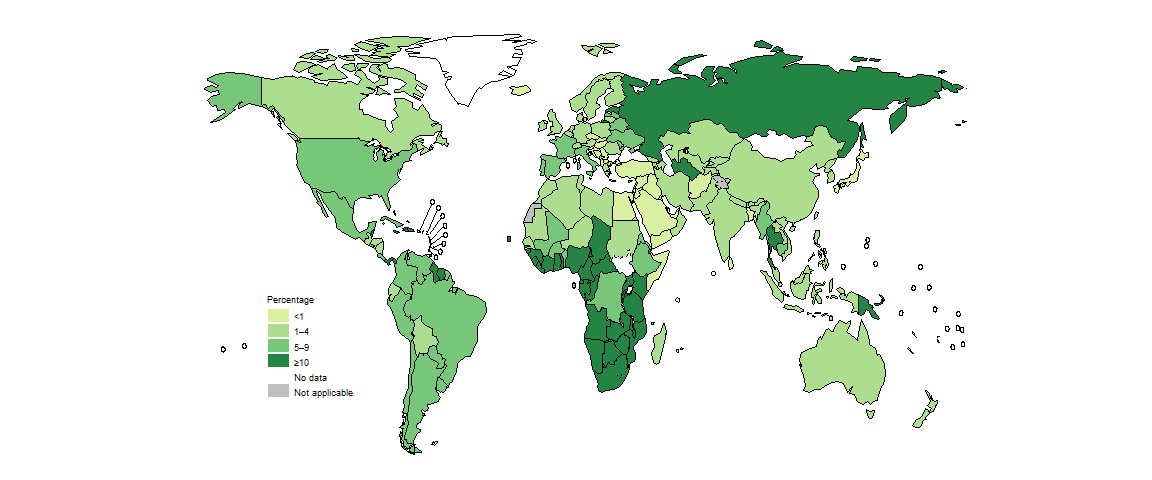
(d) Diabetesb
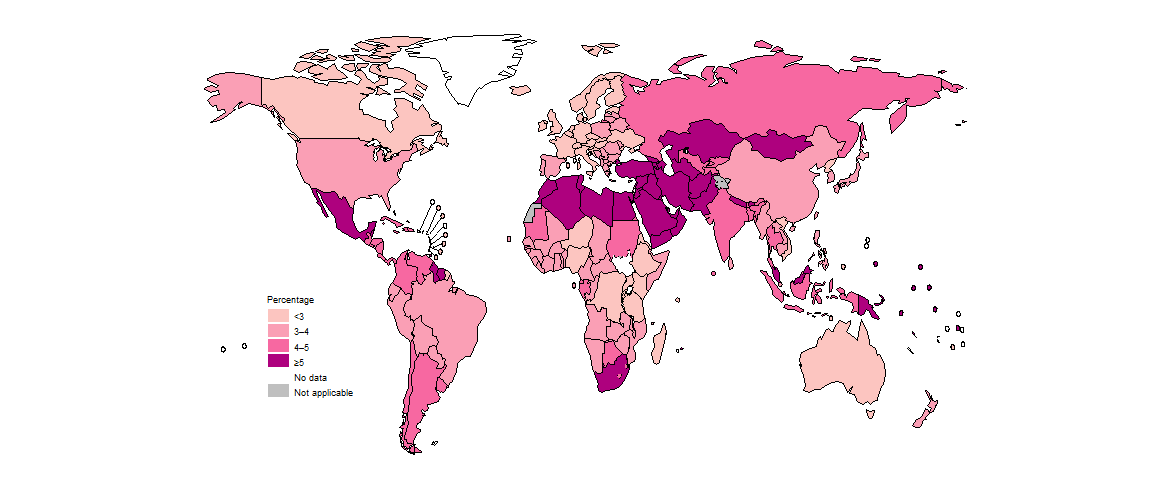
(e) Smoking
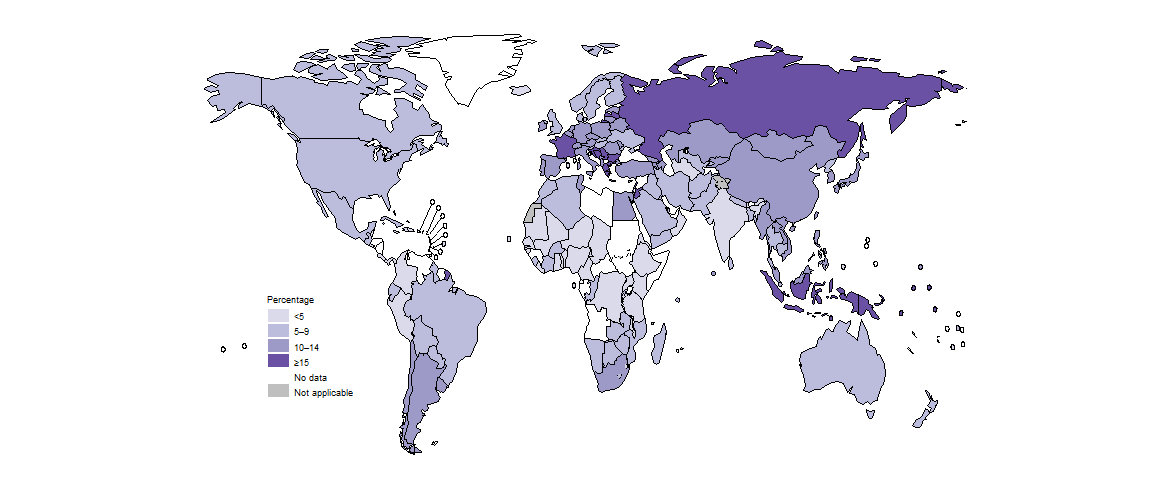
b WHO has commissioned systematic reviews to update estimates of the relative risk of TB associated with undernutrition and diabetes, which are currently in progress.
Among the 30 high TB burden countries, undernourishment is the leading contributor in most countries, although HIV infection is the top contributor in several African countries, especially in southern and east Africa (Fig. 5.3.4).
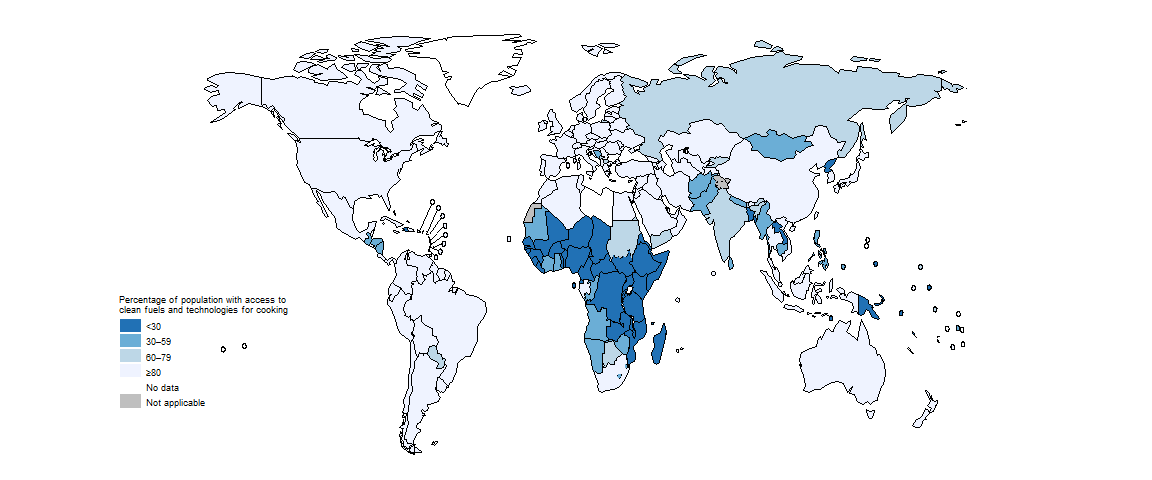
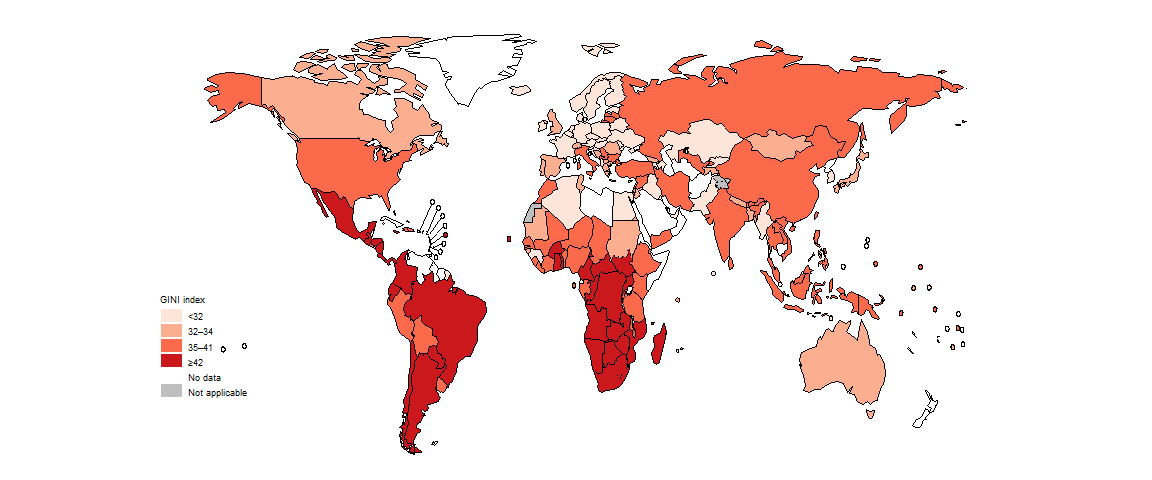
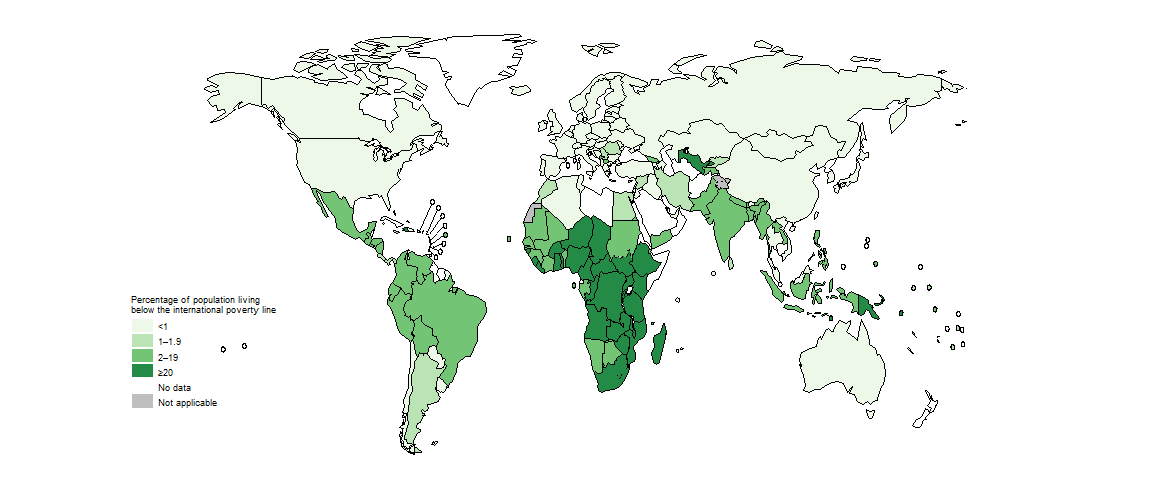
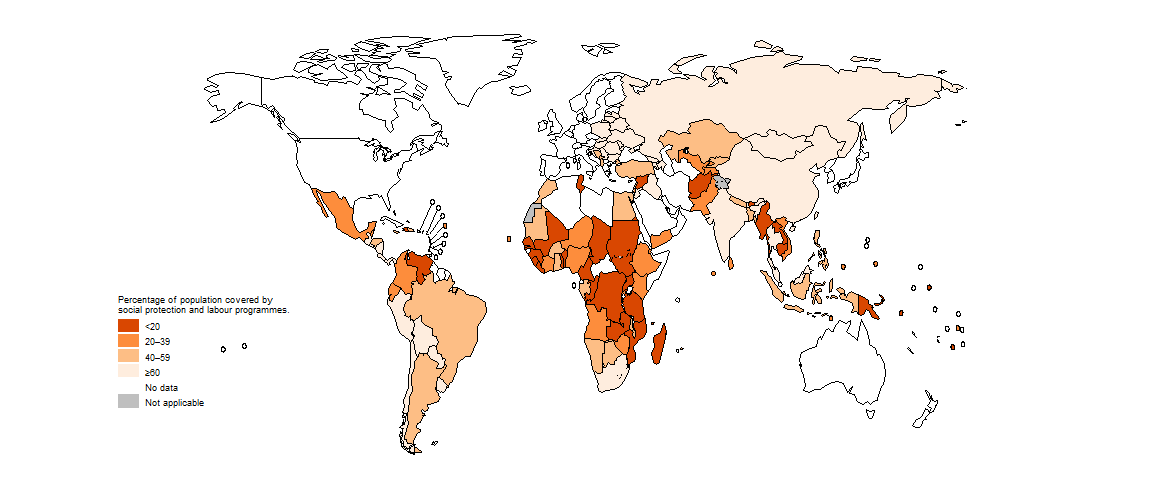
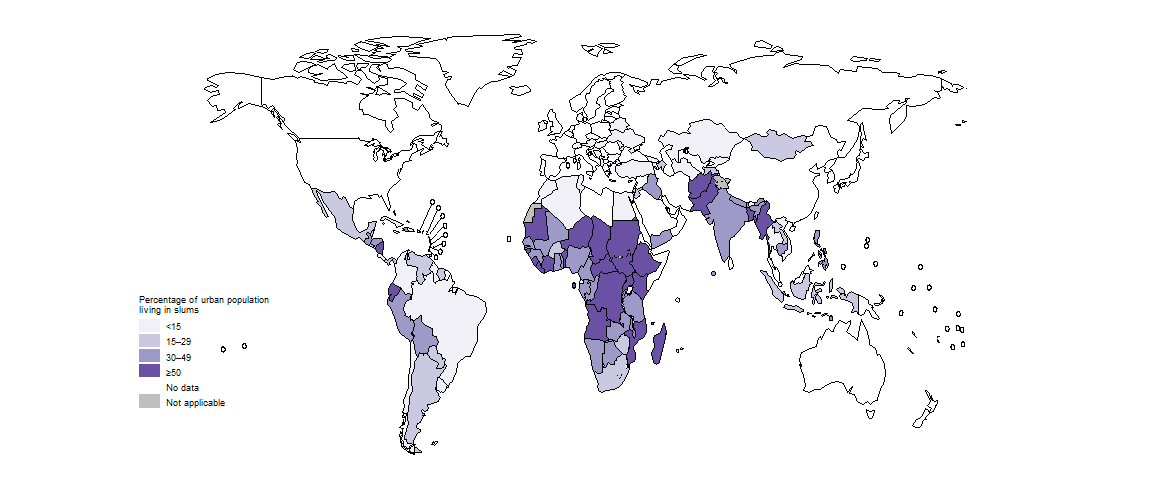
The status of TB determinants beyond those included under SDG 3 is shown in Fig. 5.3.5. Poor access to clean cooking fuels, a high percentage of the population living in poverty, low access to social protection and a high percentage of the urban population in living in slums are most common in countries in the African Region. The percentage of the population that is undernourished is comparatively high in countries in the South-East Asia Region and the African Region. Income inequality is high in countries in the Region of Americas and the African Region.
(a) Access to clean cooking fuels
(b) Income inequality
(c) Living in poverty
(d) Access to social protection
(e) Living in slums
(f) Undernourishment

Income inequality: GINI index is shown where 0 is perfect equality and 100 is perfect inequality.
Living in poverty: Percentage of population living below the international poverty line, which is defined e.g. living on $ 1.90 per day (at 2017 purchasing power parity).
Access to social protection: Percentage of population covered by social protection and labour programmes.
Living in slums: Percentage of urban population living in slums.
Undernourishment: Percentage of population undernourished.
Source: World Bank Sustainable Development Goals Database (http://datatopics.worldbank.org/sdgs/)
The most recent data for undernourishment (an indicator under SDG 2) and five socioeconomic indicators associated with TB incidence for the 30 high TB burden countries are shown in Fig. 5.3.6. In this figure, the outer edge of the circle (100) is the ideal value for each indicator. To represent this situation visually, the indicators “proportion of the urban population living in slums” and “proportion of the population living below the international poverty line” are inverted.
All indicator values in the figure are for the general population as opposed to people with TB; values for TB patients specifically (e.g. out-of-pocket expenditure and access to social protection) may differ from these general values.
Income equality: An inverse GINI index is shown where 0 is perfect inequality and 100 is perfect equality.
Not in poverty: Percentage of population living above the international poverty line, which is defined e.g. living on $ 1.90 per day (at 2017 purchasing power parity).
Not in slums: Percentage of urban population not living in slums.
Social protection: Percentage of population covered by social protection and labour programmes.
Nutrition: Percentage of population not undernourished.
Source: World Bank Sustainable Development Goals Database (http://datatopics.worldbank.org/sdgs/).
Based on the latest available data in the World Bank database, some upper-middle-income and lower-middle-income countries (e.g. Brazil, China, India, Indonesia, Mongolia, South Africa, Thailand, and Viet Nam) appear to be performing relatively well. However, progress is likely to have been set back by the COVID-19 pandemic. Even before the pandemic, other high TB burden countries already faced major challenges in achieving a range of TB-related SDG targets. Moreover, values for poor populations and vulnerable groups most at risk of developing TB are likely to be worse than national averages. Addressing the broader social and economic determinants of the TB epidemic requires multisectoral action and accountability. Global and national progress in adapting and using the WHO multisectoral accountability framework for TB (MAF-TB) is one of the featured topics of this report.
Further country-specific details for the 14 indicators related to TB incidence are available in the Global tuberculosis report app and Country profiles.
References
Grange JM, Gandy M, Farmer P, Zumla A. Historical declines in tuberculosis: nature, nurture and the biosocial model. Int J Tuberc Lung Dis. 2001;5(3):208–12 (https://www.ncbi.nlm.nih.gov/pubmed/11326817).
Styblo K, Meijer J, Sutherland I. [The transmission of tubercle bacilli: its trend in a human population]. Bull World Health Organ. 1969;41(1):137–78 (https://www.ncbi.nlm.nih.gov/pubmed/5309081).
Imtiaz S, Shield KD, Roerecke M, Samokhvalov AV, Lönnroth K, Rehm J. Alcohol consumption as a risk factor for tuberculosis: meta-analyses and burden of disease. Eur Respir J. 2017;50 (https://pubmed.ncbi.nlm.nih.gov/28705945/).
Hayashi S, Chandramohan D. Risk of active tuberculosis among people with diabetes mellitus: systematic review and meta-analysis. Trop Med Int Health. 2018;23:1058-70 (https://pubmed.ncbi.nlm.nih.gov/30062731/).
Lönnroth K, Castro KG, Chakaya JM, Chauhan LS, Floyd K, Glaziou P et al. Tuberculosis control and elimination 2010-50: cure, care, and social development. The Lancet. 2010;375:1814-29 (https://pubmed.ncbi.nlm.nih.gov/20488524/).
