2.3 TB treatment: coverage and outcomes
To minimize the ill health and mortality caused by TB, everyone who develops TB disease needs to be able to promptly access diagnosis and treatment.
There are still wide gaps between the estimated number of people who develop TB each year (incident cases; see Section 1.1 for further details) and the number of people newly diagnosed with TB and officially reported as a TB case (Fig. 2.3.1). This reflects a mixture of (i) underdiagnosis and (ii) underreporting of people diagnosed with TB to national authorities. Disruptions associated with the COVID-19 pandemic caused a major widening of the global gap in 2020, when the number of people newly diagnosed with TB and officially reported as a case fell by 18%, from 7.1 million in 2019 to 5.8 million in 2020 (see Section 2.1 for further details).
Following a major rebound in global notifications of people newly diagnosed with TB in 2021 and 2022, the gap in 2022 narrowed to pre-pandemic levels. However, it is important to highlight that some of the rebound in the number of people newly diagnosed with TB and reported as a “new case” in 2021 and 2022 likely reflects a backlog of people who developed TB in previous years; they were not “incident cases”, but rather people whose diagnosis was delayed by COVID-related disruptions.
TB treatment coverage can be approximated as the number of people newly diagnosed with TB and officially reported as a TB case in a given year (i.e. the black lines in Fig. 2.3.1), divided by the estimated number of people who developed TB in the same year (i.e. the green curves in Fig. 2.3.1), expressed as a percentage.
Globally, there were steady improvements in TB treatment coverage between 2010 and 2019: from 51% in 2010 (95% uncertainty interval [UI]: 41–65%) to 57% (95% UI: 52–63%) in 2015 and then 70% (95% UI: 66–74%) in 2019 (Fig. 2.3.2). Disruptions caused by the COVID-19 pandemic then resulted in a sharp reversal of progress in 2020: treatment coverage was only 58% (95% UI: 55–62%), back to the level of 2015. Following the rebound in notifications of people newly diagnosed with TB in 2021 and 2022 (Fig. 2.1.1 of Section 2.1), TB treatment coverage at global level appears to have recovered to pre-pandemic levels (Fig. 2.3.2). However, as already highlighted above, some of this rebound likely reflects a backlog of people who developed TB in previous years (and were thus not “incident” cases): this effect distorts estimates of treatment coverage in 2021 and 2022.
Trends among the six WHO regions also vary: for example, treatment coverage remained below pre-pandemic levels in the Region of the Americas as well as the European and Western Pacific regions in 2022. Among the six WHO regions in 2022, TB treatment coverage was highest in the Region of the Americas (with a best estimate of 74%) and lowest in the Western Pacific Region (with a best estimate of 63%).
Of the 30 high TB burden countries, those with the highest levels (>80%) of treatment coverage in 2022 included Brazil, Papua New Guinea, Uganda and Zambia (Fig. 2.3.3). In Uganda, nationwide efforts to find people with TB through mass community-based screening have been implemented, linked to COVID recovery efforts. This will have identified prevalent cases; the screening and diagnostic algorithm (which relies mainly on Xpert testing) may also lead to some overdiagnosis, since there is a high probability of false-positive Xpert results among people in the general community (1). The high estimate for Mozambique may reflect over-diagnosis of TB, with a very low proportion of reported cases diagnosed based on bacteriological confirmation: 43% in 2022 (Section 2.2). Five high TB burden countries had worryingly low levels of treatment coverage in 2022, with best estimates of below 50%: the Central African Republic, Lesotho, Liberia, Mongolia and Myanmar.
Estimated treatment coverage is much lower among children than adults (Fig. 2.3.4). Globally in 2022, treatment coverage was 49% (95% UI: 45–53%) among children aged 0–14 years (the age groups related to children for which WHO routinely collects data are 0–4 and 5–14 years; it is recognized that the second category includes young adolescents). The best estimate for those aged 15 years and above was 73%.
b The age groups related to children for which WHO routinely collects data are 0–4 and 5–14 years; it is recognized that the second category includes young adolescents.
c Log scale.
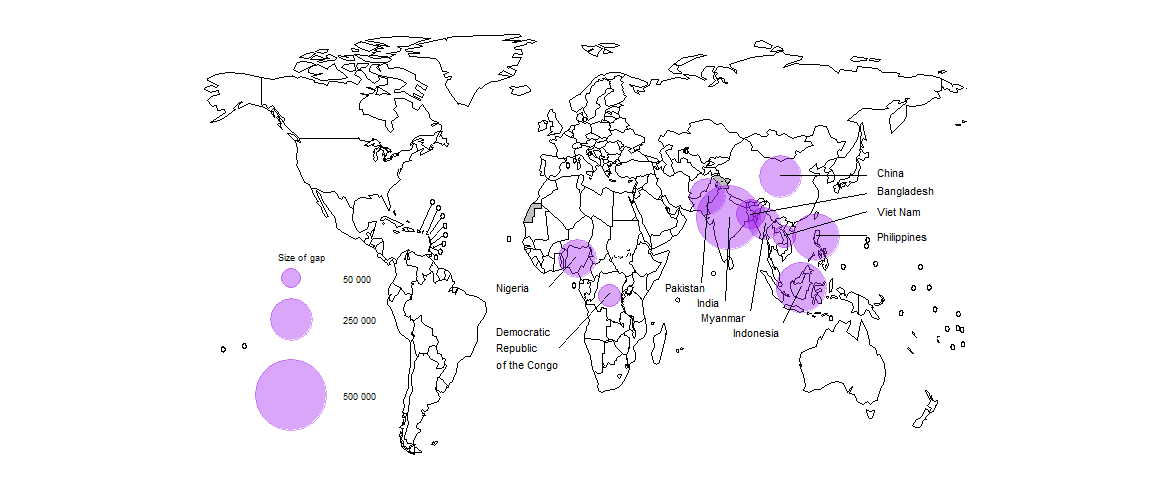
In 2022, ten countries accounted for 71% of the global gap between the estimated number of people who developed TB (incident TB cases) and the number of people who were diagnosed with TB and officially reported as a TB case (Fig. 2.3.5). About 50% of the global gap was accounted for by five countries: India (18%), Indonesia (11%), the Philippines (9.6%), Nigeria (6.2%) and Pakistan (5.8%).

Among people living with HIV who develop TB, both TB treatment and antiretroviral treatment (ART) for HIV are necessary to prevent unnecessary deaths from TB and HIV. Since 2019, the global coverage of ART for people newly diagnosed and reported with TB and known to be living with HIV has been maintained at the level of 85% (Fig. 2.3.6). However, when compared with the total estimated number of people living with HIV who developed TB in 2022 (the red curve), coverage was much lower, at 54%, up from 46% in 2021. This was far below the overall coverage of ART for people living with HIV, which was 76% (95% UI: 65–89%) at the end of 2022 (2). The main reason for relatively low coverage remains the big gap between the estimated number of people living with HIV who developed TB in 2022 and the number of people living with HIV who were reported to have been diagnosed with TB in 2022.
Fig. 2.3.6 Estimated global number of incident cases of TB among people living with HIV (red) compared with the global number of people notified with a new or relapse episode of TB who were known to be people living with HIV (black) and the global number of TB patients who were started on antiretroviral therapy (blue), 2010–2022
Among the 30 high TB/HIV burden countries, best estimates of the coverage of ART among people living with HIV who developed TB in 2022 varied widely, from 10% in Congo to 97% in Uganda; only 17 of these 30 countries achieved coverage of at least 50% (Fig. 2.3.7).
Globally in 2021 (the latest annual patient cohort for which data are available), the treatment success rate for people treated for TB with first-line regimens was 88%, and ranged among WHO regions from 68% in the European Region to 92% in the Eastern Mediterranean Region (Fig. 2.3.8).
The treatment success rate globally was higher in 2021 than in 2019, and the level in 2020 was the same as in 2019 (Fig. 2.3.9). This suggests that the quality of care for those diagnosed with TB and initiated on treatment was sustained despite the many disruptions caused by the COVID-19 pandemic in 2020 and 2021, a major collective achievement of many countries.
Treatment success rate remains lower among people living with HIV, at 79% globally in 2021, although there have been considerable improvements over time.
Among WHO regions, the best treatment success rate among people living with HIV was achieved in the African Region, where the burden of HIV-associated TB is highest (Fig. 2.3.10).
Among the 49 countries in one of the three global lists of high burden countries (for TB, HIV-associated TB and MDR/RR-TB) being used by WHO in the period 2021–2025 (Annex 3), 26 countries reported treatment outcome data disaggregated by sex. The treatment success rate in women and girls was 90% in 2021, slightly higher than (but very similar to) that among men and boys (Fig. 2.3.11).
The treatment success rate for people aged 0–14 years was 91% in 2021 (Fig. 2.3.12).
In combination, TB treatment and provision of ART to HIV-positive people diagnosed with TB are estimated to have averted 44 million deaths between 2010 and 2022 (Table 2.3.1).
| WHO region | Best estimate | Uncertainty interval | Best estimate | Uncertainty interval | Best estimate | Uncertainty interval |
|---|---|---|---|---|---|---|
| African Region | 5.2 | 4.3–6.2 | 4.8 | 4.1–5.5 | 10 | 8.9–11 |
| Region of the Americas | 1.2 | 1.0–1.3 | 0.23 | 0.21–0.24 | 1.4 | 1.3–1.5 |
| South-East Asia Region | 18 | 15–21 | 0.85 | 0.53–1.2 | 19 | 16–22 |
| European Region | 1.1 | 0.95–1.2 | 0.21 | 0.18–0.25 | 1.3 | 1.2–1.4 |
| Eastern Mediterranean Region | 3.4 | 2.9–3.9 | 0.062 | 0.047–0.078 | 3.5 | 3.0–4.0 |
| Western Pacific Region | 9.0 | 8.0–10 | 0.32 | 0.26–0.37 | 9.3 | 8.3–10 |
| Global | 38 | 33–43 | 6.4 | 5.5–7.3 | 44 | 39–49 |
The combination of TB treatment and ART for people living with HIV is estimated to have averted 9.2 million deaths between 2005, the first year following the release of an interim WHO policy on collaborative TB/HIV activities in 2004 (3), and 2022.
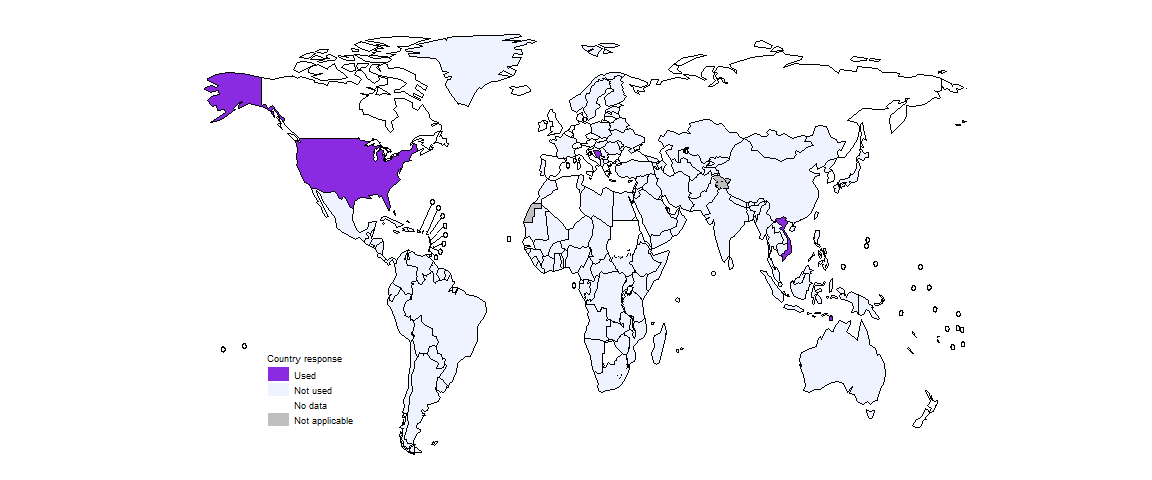
A 4-month regimen composed of isoniazid, rifapentine, moxifloxacin and pyrazinamide (HPMZ) has been recommended by WHO for the treatment of rifampicin-susceptible TB since 2022 (4). By the end of 2022, five countries had started to use the new 4-month HPMZ regimen for this purpose: Bosnia and Herzegovina, Sint Maarten (Dutch part), Timor-Leste, the United States of America and Viet Nam (Fig. 2.3.13).

Further country-specific details about the gap between TB incidence and notifications, estimated levels of TB treatment coverage and treatment outcomes are available in the Global tuberculosis report app and country profiles.
Data shown on this webpage are as of 21 July 2023 (see Annex 2 of the main report for more details).
References
National tuberculosis prevalence surveys: what diagnostic algorithms should be used in future? Geneva: World Health Organization; 2023 (https://iris.who.int/handle/10665/367909).
Global HIV & AIDS statistics – fact sheet [website]. Geneva: UNAIDS; 2023 (https://www.unaids.org/en/resources/fact-sheet).
Interim policy collaborative TB/HIV activities. Geneva: World Health Organization; 2004 (https://iris.who.int/handle/10665/78705).
WHO consolidated guidelines on tuberculosis, Module 4: Treatment – drug-susceptible tuberculosis treatment. Geneva: World Health Organization; 2022 (https://iris.who.int/handle/10665/353829).
