Investments on R&D for product development and publications volume compared to DALYs for neglected diseases
Published: January 2017
Priority setting processes for health R&D frequently include the assessment of burden of disease. Exploring the relationship between burden of disease and research funding is one method of examining past funding decisions and identifying areas of potential need for new R&D investments.
However, current estimated burden of disease is only one of the elements that inform the process of prioritizing new R&D investments; it should not be seen as the only conclusive interpretation of potential gaps in health R&D. See the Methods section for relevant documents on prioritization processes and practices.
The objective of the analysis below is to explore possible ways by which to elicit the relationship between past investments, publication volume (as a proxy for R&D funding), and the burden of disease and to stimulate thinking on possible metrics to track and assess investment decisions for health R&D.
The analysis compares three sets of data:
- The average yearly product-related R&D funding for a select number of neglected diseases (for the period 2007 to 2014, after adjusting for inflation to 2014 US$).1
- The average yearly volume of publications for the selected diseases (for the period 2007 to 2014)
- The disease burden in DALYs for the selected diseases (2012).2
See also:
What you see | Scope and limitations | Data sources | Current version
What you see
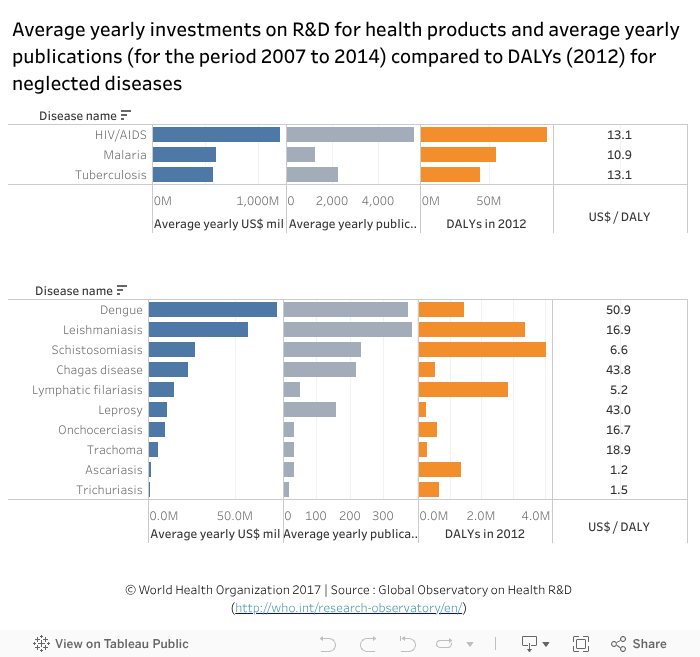
The data visualization compares the average yearly investments on R&D for health products and average yearly publications (for the period 2007 to 2014) and burden of disease (DALYs, 2012). These are illustrated separately for two sets of diseases (top and bottom) to allow better visualization of the data. The top chart includes the three diseases with the highest investments and disease burden: HIV/AIDS, malaria and tuberculosis. The bottom chart includes a select number of other infectious diseases for which investment data are available.
R&D investments should be interpreted with caution due to the scope restrictions of the underlying data from the G-FINDER survey (see below).
Points to :
- Among the three diseases with the highest burden, HIV/AIDS received the highest investments and had the highest number of publications per year (top chart).
- While malaria received similar yearly investments to tuberculosis, the publication volume was almost half of that of tuberculosis (top chart).
- The bottom chart raises interesting questions about the relationship between investments, publication volume and burden of disease. For example (hover the cursor on a bar in a graphic to see more information in a popup window):
-- Schistosomiasis, the disease with the highest burden among this group, received only 6.6 US$/DALY on average compared to diseases such as dengue (50.9 US$/DALY), Chagas disease (43.8 US$/DALY), and leprosy (43 US$/DALY).
- As can be expected, there is no clear relationship between R&D investment and publication volume (bearing in mind the scope restriction of the R&D investments) since one publication/study can involve a large multi-country trial and another a small scale study in a particular area. For example:
-- While onchocerciasis received six times as much funding than ascariasis (US$ 10 million and US$ 1.6 million respectively) , the volume of average yearly publications was similar (32 and 34 respectively).
-- The volume of publications on
leprosy was almost five times higher than that on onchocerciasis for a similar level of funding (US$ 11 million and US$ 10 million respectively).
Scope and limitations
Diseases selected for this analysis (see links at the bottom under “see also”) were determined by the availability of both burden of disease and R&D funding data.
Publication volume was collected from GoPubMed; see the search methodology and analysis for more detail on the findings by disease.
The data must be interpreted with caution because of the specific scope restrictions of the G-FINDER survey (see links below and analysis of the G-FINDER R&D funding flows for neglected diseases for more detail on the scope and findings).
G-FINDER scope and restrictions
1. https://gfinder.policycures.org/PolicyCures/rdScope
2. https://gfinder.policycures.org/staticContent/pdf/ND_matrix.pdf
Data sources
1 Adjustment for inflation is made by the source: Policy Cures Research G-FINDER Survey.
2 Latest estimates available from source: WHO Global Health Estimates.