Distribution of R&D funding flows for neglected diseases (G-FINDER), by source and type of funding
Published: January 2018
The product-related R&D funding flows for neglected diseases are collected from the Policy Cures Research G-FINDER survey. For 2016, funding data were collected from 187 private, public and philanthropic organizations, on all types of product-related R&D and basic research and platform technology covering 33 neglected diseases (note: the disease names have been reclassified here, see the section for the rationale and approach).
See also:
What you see | Scope and limitations | Data sources | Current version
What you see
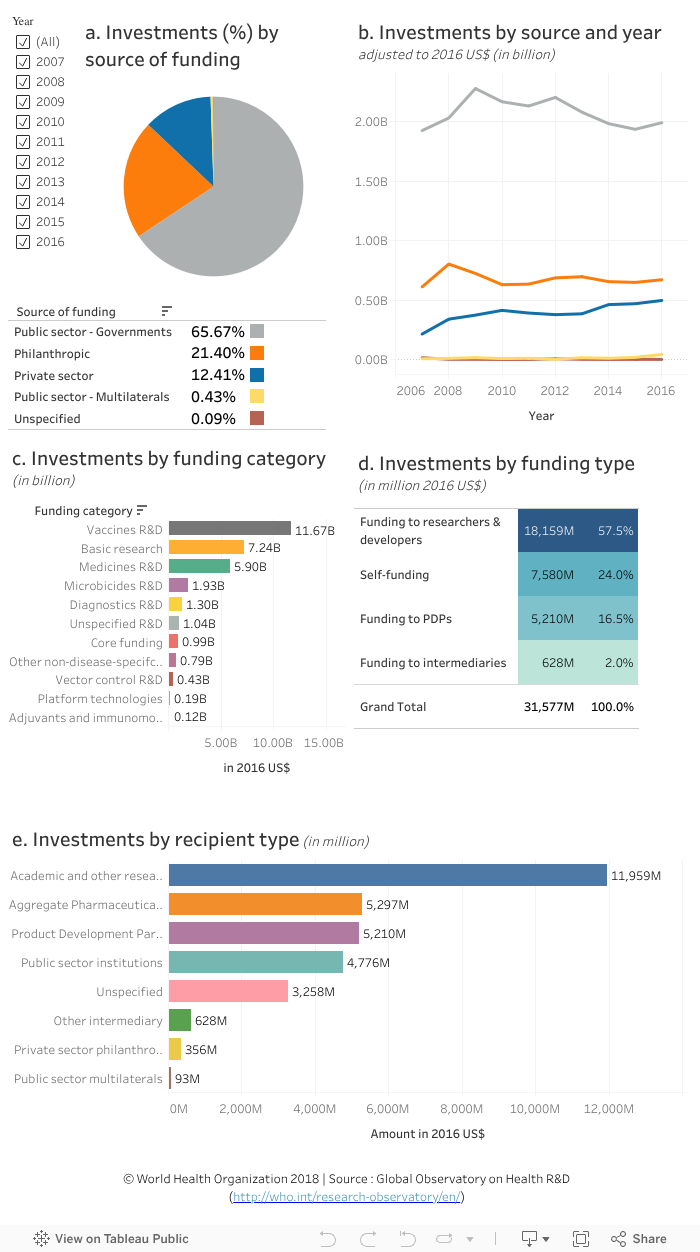
- The data visualization illustrates the funding flows for neglected diseases by source of funding (chart a), yearly trends in investments by source (chart b), funding category (chart c), funding type (chart d), and by recipient organization type (chart e) for the period 2007–2016. The date in the years prior to 2016 are adjusted for inflation and presented in 2016 US$ (adjustment performed by the data source).
Points to note:
- The G-FINDER survey data underestimate the total R&D investments for these diseases as reporting is incomplete and need to be interpreted cautiously due to the scope restrictions of the survey (outlined below).
- Over the ten years of investments on neglected diseases:
-- A total of US$ 31.6 billion was invested (chart d) with the largest share of investments by public sector governments (65.7%), followed by philanthropic (21.4%) and the private sector (12.4%) (chart a).
-- More than half of the total investments went to researchers and developers (US$ 18.1 billion; 57.5%) (chart d), which were mainly funded by public sector governments (79.7%), followed by philanthropic (19.8%) (select “Funding to researchers & developers” in chart d and see chart a).
-- Funding for vaccines R&D have also been predominantly financed by public sector governments (64.8%), followed by philanthropies (21.6%), while the share of funding flows for medicines R&D is more evenly distributed among the three main sources of funding: public sector governments (35.1%), the private sector (34.9%) and philanthropies (28.7%) (click on the funding category listed in chart c and see chart a).
-- Academic and other research institutions received the highest share of funding (US$ 12 billion, 37.9%), followed by aggregate pharmaceutical and biotechnology companies and product development partnership (PDP) (US$ 5.3 (16.8%) and US$ 5.1 billion (16.5%) respectively; chart e-see information in popup window). - Compared to previous years, in 2016:
-- Public sector governments and the private sector have both increased their investment in vaccines R&D (select “vaccines R&D” in chart c and see chart b).
-- Public sector governments and philanthropies have increased their funding support to researchers and developers, which was the first time since 2012 for public sector governments (select “Funding to researchers & developers” in chart d and see chart b). Funding to researchers and developers were mainly dedicated to basic research and vaccines R&D (US$ 6.3 and 6.1 billion respectively; chart c).
-- Funding to PDPs from philanthropic was at their lowest with a decrease from US$ 0.31 billion in 2014 to US$ 0.24 billion in 2016, (select “Funding to PDPs” in chart d and see chart b).
To explore the data further:
- Select a source of funding, a funding category or other selections to filter the corresponding information in the other charts.
- To filter results for a different year or range of years, untick All in the year filter on the top left and select the year (or years) of interest.
- Hover the cursor on a slice in the pie or a bar in a graphic to see more information in a popup window.
- Undo a selection by clicking ‘undo’ or ‘reset’ near the bottom of the page or by clicking the same element again.
Scope and limitations
The data must be interpreted cautiously because of the specific scope restrictions of the G-FINDER survey (see link below for detail). The scope of the G-FINDER survey is determined by applying the following three criteria for neglected diseases. (R&D investments which do not meet these criteria are excluded.)
- The disease disproportionately affects people in developing countries.
- There is a need for new products (i.e. there is either no existing product, or improved or additional products are needed).
- There is market failure in developing these new products (i.e. there is an insufficient commercial market to attract R&D by private industry).
For some diseases, only R&D funding for developing-country specific serotypes/strains or products are included. For example, only genotypes 4, 5, and 6 are included for Hepatitis C.
Note that this latest data visualization does not contain data for R&D funding for Ebola and other viral haemorrhagic fevers (contained in the visualization published by the Observatory in July 2017) as the data for these have not been updated by Policy Cures Research. A separate report focusing on emerging infectious diseases (EIDs) identified in the WHO R&D Blueprint will address these; its data will be visualized and provided in the Observatory once available.
Note: For this set of analysis, developing-country-specific research on therapeutic vaccines for HIV/AIDS was included with vaccines R&D as a restricted category, reflecting emerging research into broadly neutralizing anti-HIV antibodies (bNAbs) and their potential use in developing countries.