Distribution of R&D funding flows for neglected diseases by source and type of funding
Published: October 2024
The product-related R&D funding flows for neglected diseases are collected from the Impact Global Health G-FINDER survey. For 2022, funding data were collected from private, public and philanthropic organizations, on all types of product-related R&D and basic research and platform technology covering neglected diseases (Note: Disease names used here have been reclassified; see the " Classifications and standards" section for the rationale and approach).
See also:
What you see
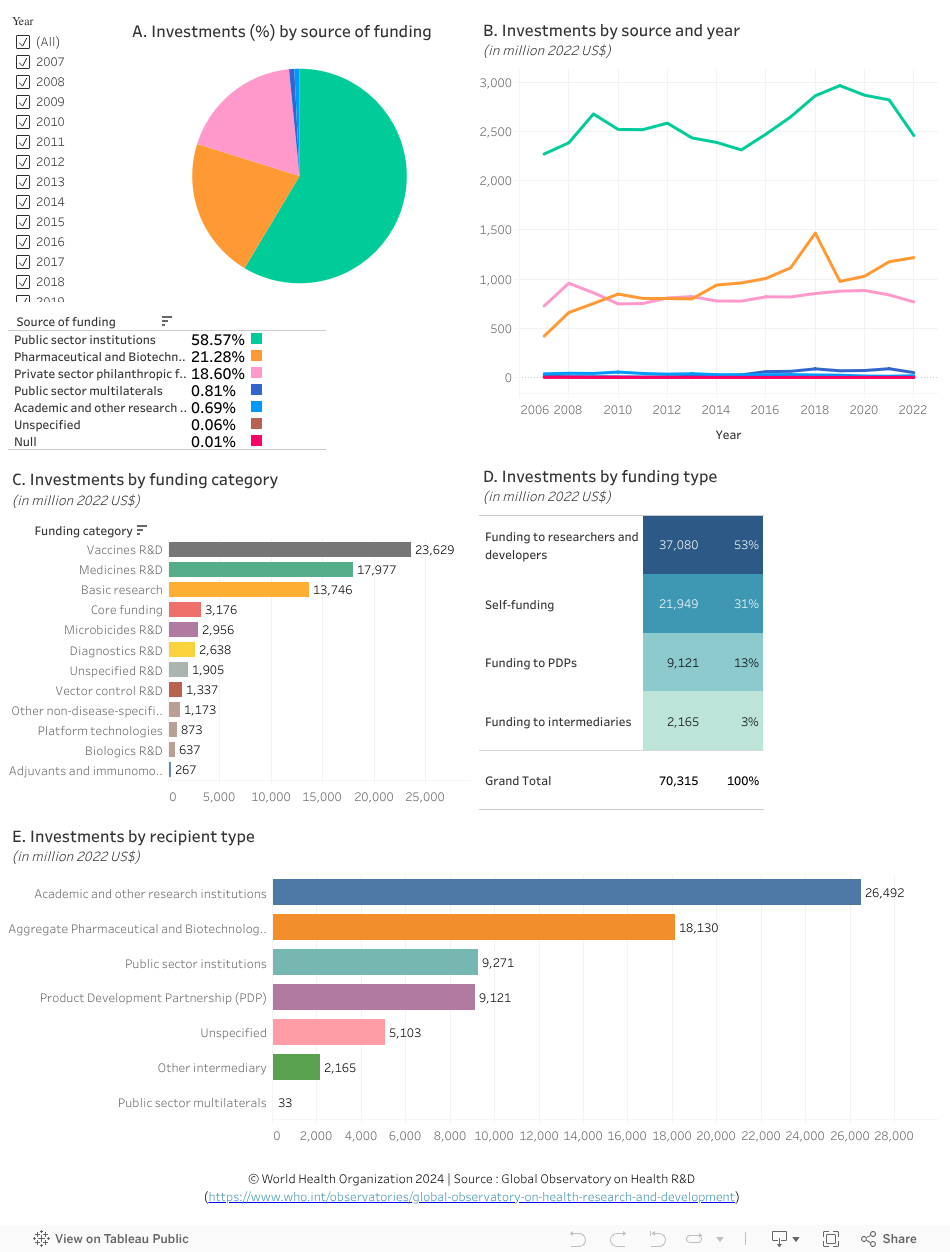
The data visualization illustrates the funding flows for neglected diseases by source of funding (chart A), yearly trends in investments by source (chart B), funding category (chart C), funding type (chart D), and by recipient organization type (chart E) for the period 2007–2022. All funding data have been adjusted for inflation and are reported in 2022 US dollars (US$) (adjustment performed by the data source).
Points to note:
- The G-Finder survey data underestimate the total R&D investments for these diseases as reporting is incomplete and needs to be interpreted cautiously due to the scope restrictions of the survey.
- Over the 16 years of investments on R&D for neglected diseases:
-- A total of US$ 70 billion was invested (chart D) with the largest share of investments by public sector institutions (59%), followed by an increase of over 10% from pharmaceutical and biotechnology companies (21%) and private sector philanthropic foundations (19%) (chart A).
-- More than half of the total investments went to researchers and developers (US$ 37.08 billion) (chart D), which were mainly funded by public sector institutions for 78%, followed by private sector philanthropic foundations (21%) (select “Funding to researchers & developers” in chart D and see chart A).
-- Funding for vaccines R&D have also been predominantly financed by public sector institutions (59%), followed by pharmaceutical and biotechnology companies (22%), while the share of funding flows for medicines R&D is more evenly distributed among the three main sources of funding: pharmaceutical and biotechnology companies (49%), public sector institutions (31%) and private sector philanthropic foundations (18%) (click on the funding category listed in chart C and see chart A). - Compared to previous years, in 2022:
-- Investments in neglected diseases R&D has dropped from public sector institutions and private sector philanthropic foundations, but have increased from pharmaceutical and biotechnology companies (select the funding source in chart A and see chart B). Medicines R&D have reached parity with vaccines R&D at the top of investments by the private sector philanthropic foundations (US$ 0.2 billion), whereas medicines R&D remain the top focus of the pharmaceutical and biotechnology companies with a greater investment amount (US$ 0.88 billion). Basic research is no longer the top investment by the public sector institutions (US$ 0.69 billion) (filter for 2022, click on the funding source in chart A and see chart C).
-- Public sector institutions and private sector philanthropic foundations together account for 98% of funding support to researchers and developers (filter for 2022, select “Funding to researchers & developers” in chart D and see chart B). Funding to researchers and developers were mainly dedicated to basic research and vaccines R&D (each at around US$ 0.6-0.7 billion in 2022; chart C).
-- Funding to PDPs from private sector philanthropic foundations and public sector institutions continues to fall and remained at its lowest level since 2007 in 2022 (US$ 0.3 billion compared to US$ 0.6 billion in 2007); (select “Funding to PDPs” in chart D and see chart A and B).
-- Academic and other research institutions received the highest share of funding (US$ 26.49 billion, 38%), followed by aggregate pharmaceutical and biotechnology companies (US$ 18.13 billion (26%)) (chart E-see information in popup window).
Scope and limitations of the data source
The data must be interpreted cautiously because of the specific scope restrictions of the G-FINDER survey (see link below for detail). The scope of the G-FINDER survey is determined by applying the following three criteria for neglected diseases (R&D investments which do not meet these criteria are excluded).
- The disease disproportionately affects people in developing countries.
- There is a need for new products (i.e. there is either no existing product, or improved or additional products are needed).
- There is market failure in developing these new products (i.e. there is an insufficient commercial market to attract R&D by private industry).
The COVID-19 pandemic slightly altered the participation in the 2019 G-Finder survey, which meant that some of the reduction in funding in the previous analysis was the result of the reduced reporting rather than an actual drop in funding. In the 2022 report, some of these 2019 figures were reviewed to correct these drops and supersede the numbers presented in previous analysis.
Histoplasmosis (here under Mycoses) and scabies were added to the G-Finder survey scope. This includes R&D for all product categories for both diseases, all basic research for histoplasmosis and basic research that is explicitly targeted at low- and middle-income country (LMIC)-related disease burden for scabies. LMIC-focused basic research on rotavirus and Enterotoxigenic E. coli (both under Diarrhoeal diseases) were also included. And restriction requiring hepatitis C vaccine R&D to be LMIC-specific has been relaxed. This increase in scope accounts for no more than 0.2% of global funding in 2020.
To explore the data further
- Select a source of funding, a funding category or other selections to filter the corresponding information in the other charts.
- To filter results for a different year or range of years, untick All in the year filter on the top left and select the year (or years) of interest.
- Hover the cursor on a slice in the pie or a bar in a graphic to see more information in a popup window.
- Undo a selection by clicking ‘undo’ or ‘reset’ near the bottom of the page or by clicking the same element again.
Data sources
G-FINDER scope and restrictions
Previous versions
December 2022 | November 2021 | April 2020 | February 2019 |
January 2018 | July 2017