Investments on grants for biomedical research by funder, type of grant, health category and recipient
Published: January 2021
Since 2012, World RePORT has collected grants data for biomedical research from a growing number of major funders of health research. Presented here is information on investments on biomedical grants for 2018 by the 11 funders that reported these data to World RePORT. See more about the scope and limitations of World RePORT below.
See also:
What you see | Scope and limitations | Data sources | Current version
What you see
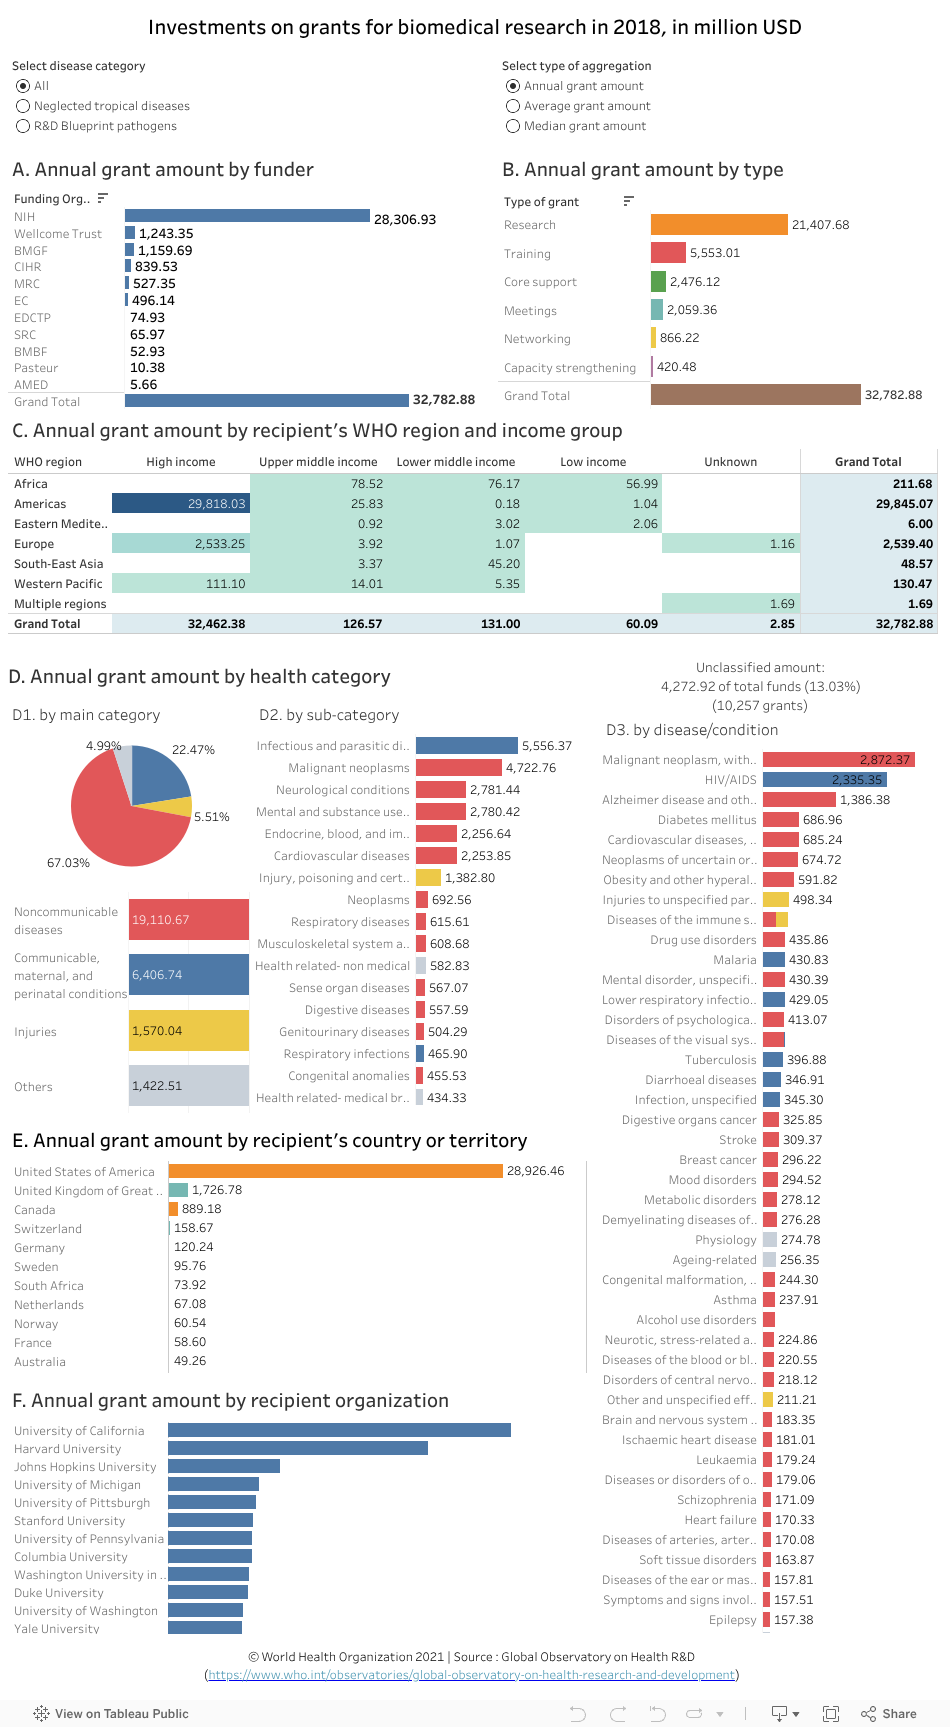
The data visualization above shows annual investments on grants (referred to in the charts and the analysis below as annual grants amounts) based on data from World RePORT for the year 2018 by:
- funder (chart A)
- type of grant (chart B)
- recipient’s WHO region and income group (chart C)
- health category (colour coded by main health category) (chart D, with data broken down into charts D1, D2 and D3)
- recipient’s country or territory (chart E)
- recipient organization (chart F)
In instances where investment figures represented a period of more than one year, they were converted to give an annual amount.
Points to note:
For biomedical research across the 10 funders that reported data for the year 2018:
- The United States of America’s National Institutes of Health (NIH) awarded the highest total annual grant amount (approximately US$ 28 billion; 86%), followed by the Wellcome Trust (approx. US$ 1.24 billion; 3.8%) (chart A; hover over bars for details of percentages).
- Focusing on average grant amount, the BMGF awarded the highest average grant amount (approx. US$ 1.2 million), followed by the European Commission (EC) (approx. US$ 0.7 million) and the European and Developing Countries Clinical Trials Partnership (EDCTP) (approx. US$ 0.6 million). (Select the “Average grant amount" from the “Type of aggregation” options at the top of the visualization and then view chart A.)
- The largest proportion of the total annual grant amount was awarded for research (65%; approx. US$ 21 billion), followed by training (17%; approx. US$ 6 billion) and core support (8%; approx.US$ 2 billion) (chart B).
- When looking at the average grant amounts by type of grant, networking came top with approx. US$ 1.4 million on average per grant. (Select the “Average grant amount" from the type of aggregation options at the top of the visualization and then view chart B).
- Low-income countries received the lowest proportion of the annual grant amount (0.2%; approx. US$ 0.06 billion), with the majority of low-income recipient countries being in the WHO African region (chart C).
- The WHO region of the Americas received the highest proportion of the annual grant amount (91%; approx. US$ 30 billion), whereas the WHO Eastern Mediterranean region received the lowest (0.02%; approx. US$ 0.01 billion) (chart C).
- The largest proportion of the total annual grant amount was awarded for noncommunicable diseases (67%; approx. US$ 19 billion). This was followed by communicable, maternal, and perinatal conditions (22%; approx. US$ 6 billion) and injuries (5.5%; approx. US$ 1.6 billion) (chart D1).
- Among noncommunicable diseases, the top sub-category (receiving a quarter of all grants) was malignant neoplasms (approx. US$ 4.7 billion; 25%), followed by neurological conditions (approx. US$ 2.8 billion; 14.6%) and mental and substance use disorders (approx. US$ 2.8 billion; 14.6%). (Select the “Noncommunicable diseases” category in chart D1 and then view the disease sub-categories in chart D2.)
- Over 87% of grants for communicable, maternal, and perinatal conditions were for infectious and parasitic diseases (approx. US$ 5.6 billion) (select “Communicable, maternal, and perinatal conditions” in chart D1 and then hover over “Infectious and parasitic diseases”) in chart D2. A total of around 57% of grants for “Infectious and parasitic diseases” were for HIV/AIDS, malaria and tuberculosis combined (HIV/AIDS = approx. US$ 2.3 billion; 42%/ malaria = approx. US$ 0.4 billion; 7%/ and tuberculosis = approx. US$ 0.4 billion; 6%). (Select the “Infectious and parasitic diseases” sub-category in chart D2 and then view chart D3.)
- The top three diseases among the WHO list of neglected tropical diseases to receive grants were dengue, human african trypanosomiasis and leishmaniasis (receiving approx. US$ 0.07 billion, US$ 0.027 billion, and US$ 0.026 billion, respectively). (Select the “Neglected tropical diseases” button from the disease category options at the top of the visualization and then view chart D3.)
- Around half of all grants for R&D Blueprint pathogens were for Ebola virus disease (45%; approx. US$ 0.1 billion). This was followed by Zika virus disease (25%; approx. US$ 0.07 billion) and Lassa fever (9%; approx. US$ 0.02 billion). (Select the “R&D Blueprint pathogens” button from the disease category options at the top of the visualization and then view chart D3.)
- Overall, almost 88% (approx. US$ 29 billion) of all the grants awarded for biomedical research were allocated to recipient organizations in the United States of America (charts E and F).
Exploring the data further
- Select a funder, a WHO region, a country, or any other category (by clicking on a bar in a chart or a cell in a table) to filter data for the desired selection in the other charts.
-- For example, selecting the “Neurological conditions” sub-category in chart D2 shows that 45% of the annual grants awarded for this health sub-category went towards research on Alzheimer disease and other dementias (approx. US$ 1 billion) (chart D3). - Hover the cursor on a data element (a bar or a cell) to see more information in a popup window (for example, percentages and other relevant categorizations). The popup information is updated automatically for any of the selections made by filtering the data in the previous step.
- Hold the ‘Ctrl’ key to select more than one option, for example, two regions.
- Undo a selection by clicking ‘undo’ or ‘reset’ near the bottom of the page or by clicking the same element again.
Scope, analysis and limitations of the data
Scope
- The World RePORT is hosted by the United States of America’s National Institutes of Health and managed through a steering committee of the agencies providing data.
- Not all funders who provide data to World RePORT report on a yearly basis. For example, at the time of this analysis, only 11 funders had reported data for grants awarded in 2018.
- The World RePORT data include direct (primary) grants provided to recipient institutions as well as collaborations with other institutions resulting from these grants (indirect grants administered by recipient institutions). This data visualization focuses on the amount of the primary grants.
- Collectively, 8 of the 12 funders that have reported since 2012 make up approximately 78% of the annual health research expenditures of 55 major public and philanthropic funders of health research according to Viergever & Hendriks 2015.
Analysis
- Automated data mining was used to generate information on the type of grant and health category using text-based data fields for each grant.
- To determine the type of grant, synonyms for the type of grant categories listed in the data visualization were extracted from the title or abstract (if available) of the grant record.
- To assign a health category to each grant, the Observatory’s compiled list of disease synonyms was used as described below. The list was compiled using as a base the Unified Medical Language System (UMLS) and the International Classification of Diseases. This was complemented by synonyms drawn from the data, mostly to account for errors in data entry such as spelling errors or use of abbreviations.
- An automated algorithm was applied to two data fields, the grant’s title and abstract, using the list of disease synonyms to generate the disease classification field used in this analysis. The algorithm stops if a match is identified using the title field, if not a match using the abstract field is pursued. The first match closer to the beginning of the text field was selected. This was considered the primary disease focus of the grant. It is possible that a grant has more than one disease focus; this is not captured in this analysis.
- The algorithm was refined through various iterations but as with any automated algorithm, it is likely that some grants were not correctly matched. A full description of the methods and approach is available in this paper: Resource allocation for biomedical research: analysis of investments by major funders.
- Investment figures in the World Report were available in various formats depending on the reporting practice of each funder. They varied either in terms of the currency used or the duration the grant represented: total grant for the entire duration
of the project, financial disbursement for the financial year, or as the total disbursement from the start of the project until the end of the financial year. These were sometimes available with or without the actual amounts allocated to collaborating
institutions. The Observatory reviewed the reporting practices of each funder and adjusted the investment figures, when needed, to the equivalent amount spanning one whole year, in this case, 2016. Grants in other currencies were converted into
US$ using the World Development Indicators (WDI) official exchange rate in 2018.
- Note that chart D only presents data for grants in which a health category was assigned; other grants, amounting to approximately US$ 4.3 billion (equivalent to 13% of total funds and 10257 grants), were unclassified. Data in chart
D is colour coded by main health category.
Limitations of the data
- For some funders, especially those with relatively new or fixed data collection platforms, the data do not accurately reflect the scale of research investments. Most funders do not include their intramural investments which can be substantial, notably the NIH and the Institut Pasteur, the latter is estimated by the data source to represent only around 8% of their entire grants.
- Reporting conventions for funding amounts are missing for some funders on the World RePORT platform. A cross-check between the data from the World RePORT and the data available from the reporting funders’ websites was therefore performed to determine the practice used.
- This analysis will be updated when new data becomes available; however, time lags with the scheduled updates by the data source are inevitable. Accuracy and completeness of the information is the responsibility of the data source, see terms and conditions of use.