Number of grants for biomedical research by funder, type of grant, duration and recipients (World RePORT)
Published: December 2025
Since 2012, World RePORT has collected grants data for biomedical research from a growing number of major funders of health research. Presented here is information on direct (primary) biomedical grants awarded in 2023 by 13 funders that reported to World RePORT. (See more about the scope and limitations of World RePORT data below.)
See also:
What you see | Scope and limitations | Data sources | Previous versions
What you see
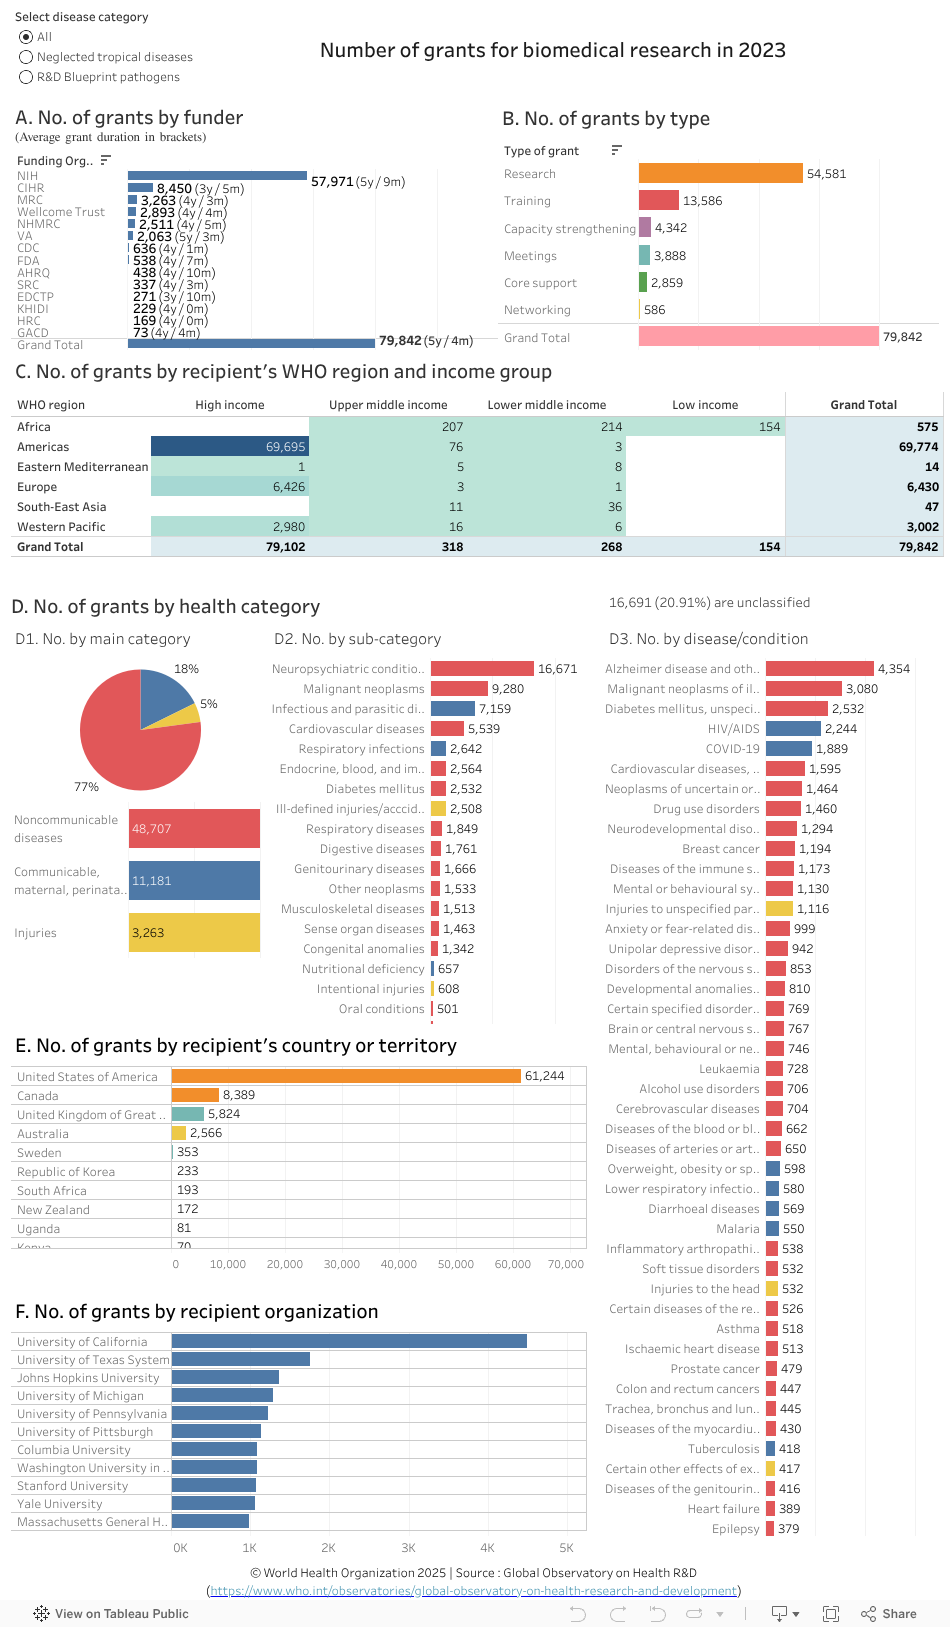
The data visualization above shows the number of direct grants based on data from World RePORT for the year 2023, by:
- Funder (with average grant duration) (chart A)
- Type of grant (chart B)
- Recipient’s WHO region and income group (chart C).
- Health category (colour coded by main health category) (chart D - with data broken down into charts D1, D2 and D3)
- Recipient’s country or territory (chart E)
- Recipient organization (chart F)
With respect to disease focus, grants for neglected tropical diseases or ‘R&D Blueprint pathogens’ can be viewed separately (select desired options using the circular buttons at the top left of the data visualization).
Points to note:
Among the grants provided in 2023 by the 13 funders:
- The total number of grants was 79 842, almost 3000 fewer grants than our last report from 2022. As shown in chart A, the United States of America’s National Institutes of Health (NIH) awarded the highest number of grants (57 971) and continues to provide the highest average grant duration (5 years).
- 68% of these grants was awarded for research (54 851) and it is here that we see the reduction of 3000 grants compared to 2022 data. Second and third most common grant type were for training (17%; 13,856) and capacity strengthening (5%; 4 342) (chart B).
- Low-income countries received only 0.2% (154) of all grants, by recipient income group (chart C) which continues to be lower than the 2020 analysis.
- Among the 575 grants received by African countries (click on the Africa region in chart C), South Africa received the highest number of grants (34%; 193), followed by Uganda (14%; 81) and Kenya (12%; 70) (chart E).
- Two-thirds of all grants were for noncommunicable diseases (77%; 48 707), although in Africa two thirds were for infectious diseases (chart D1, select Africa in chart C and read chart D1).
- Among noncommunicable diseases, the largest proportion was for neuropsychiatric conditions (34%; 16 671), followed by malignant neoplasms (19%; 9280), cardiovascular diseases (11%; 5539). (Select the noncommunicable disease category in chart D1 and see distribution by health category in chart D2).
- Among communicable, maternal, perinatal and nutritional conditions (select this category in chart D1), 64% were for infectious and parasitic diseases (7159) (chart D1), notably for HIV/AIDS (20%; 2244) and 17% of grants were focused on COVID-19 (1889) (chart D2).
- Of all grants for neglected tropical diseases (select this disease category at the top right), the ratio of most grants has changed significantly since 2020. Noma now leads in number of grants awarded (33%; 228), followed by dengue remains the NTD to receive the most number of grants (17%; 115), and Chikungunya virus disease (9%; 61) continuing to attract more grants than leishmaniasis (14% in 2020 to 8% in 2023; 54) (see chart D3 and compare to previous analyses through links at bottom of page).
- Over 90% of all grants for R&D Blueprint pathogens continue to be for COVID-19 (92%; 1889), followed by Ebola virus disease (3%; 66) (Select this disease category at the top right and see chart D3).
- Overall, around 75% (61 224) of all grants awarded for biomedical research were allocated to recipient organizations in the United States of America (chart E), with the University of California receiving the highest number of grants (4 499) (chart F). This should be taken with some caution however due to non-reporting of grants by European Commission and EDCTP in 2023.
Exploring the data further
- Select a funder, a WHO region, a country or any other category (by clicking on a bar in a chart or a cell in a table) to filter data for the desired selection in the other charts.
-- For example, by selecting "Neuropsychiatric conditions" in chart D2, chart D3 shows that "Alzheimer disease and other dementias" received the highest number of grants (4 354). - Hover the cursor on a data element (a bar or a cell) to see more information in a popup window (for example, percentages and other relevant categorizations). The popup information is updated automatically for any of the selections made by filtering the data in the previous step.
- Hold the ‘Ctrl’ key to select more than one option, for example two regions.
- Undo a selection by clicking ‘undo’ or ‘reset’ near the bottom of the page or by clicking the same element again.
Scope, analysis and limitations of the data
Scope
- The World RePORT is hosted by the United States of America’s National Institutes of Health and managed through a steering committee of the agencies providing data.
- The World RePORT data include direct (primary) grants provided to recipient institutions as well as collaborations with other institutions resulting from these grants (indirect grants administered by recipient institutions). This data visualization focuses on direct grants. Indirect grants resulting from collaborations with the primary recipient institutions are analysed separately.
- Not all funders who provide data to World RePORT report on a yearly basis. At the time of this analysis, 13 funders had reported data for grants awarded in 2023 : Agency for Healthcare Research and Quality (AHRQ), Canadian Institutes of Health Research (CIHR), Centers for Disease Control and Prevention (CDC), Food and Drug Administration (FDA), Global Alliance for Chronic Diseases (GACD), Health Research Council New Zealand (HRC-NZ), Korea Health Industry Development Institute (KHIDI), Medical Research Council (MRC), National Health Medical Research Council (NHMRC), National Institutes of Health (NIH), Swedish Research Council (SRC), U.S. Department of Veterans Affairs (VA), Wellcome Trust.
- Collectively, 8 of the 12 funders that had reported since 2012 made up approximately 78% of the annual health research expenditures of 55 major public and philanthropic funders of health research according to Viergever & Hendriks 2015.
Analysis
- Automated data mining was used to generate information on the type of grant and health category using text-based data fields for each grant.
- To determine the type of grant, synonyms for the type of grant categories listed in the data visualization were extracted from the title or abstract (if available) of the grant record.
- To assign a health category to each grant, the Observatory’s compiled list of disease synonyms was used as described below. The list was compiled using as a base the Unified Medical Language System (UMLS) and the 10th version of the International Classification of Diseases. This was complemented by synonyms drawn from the data, mostly to account for errors in data entry such as spelling errors or use of abbreviations.
- An automated algorithm was applied to two data fields, the grant’s title and abstract, using the list of disease synonyms to generate the disease classification field used in this analysis. The algorithm stops if a match is identified using the title field, if not a match using the abstract field is pursued. The first match closer to the beginning of the text field was selected. This was considered the primary disease focus of the grant. It is possible that a grant has more than one disease focus; this is not captured in this analysis.
- The algorithm was refined through various iterations and will continue to be refined in future updates but as with any automated algorithm, it is likely that some grants were not correctly matched. A full description of the methods and approach is available in this paper: Resource allocation for biomedical research: analysis of investments by major funders.
Limitations of the data
- For some funders, especially those with relatively new or fixed data collection platforms, the data do not accurately reflect the scale of research investments or collaborations between recipients of grants. Most funders did not include their intramural investments which can be substantial, notably the NIH and the Institut Pasteur, the latter is estimated by the data source to represent only around 8% of their entire grants.
- This analysis will be updated when new data becomes available; however, time lags with the scheduled updates by the data source are inevitable. Accuracy and completeness of the information is the responsibility of the data source, see terms and conditions of use.
Previous versions
October 2024|February 2023 | January 2022 | January 2021 | December 2020 | May 2019 | February 2019 | July 2017