Number of grants for health research by funder, type of grant, duration and recipients (World RePORT), July 2017
Since 2012, World RePORT has collected research grants data from 12 major funders of health research. Presented here is grant information for 9 funders who reported to World RePORT in 2016, comprising both direct and collaborative research grants. See more on the scope of World RePORT below.
What you see | Scope and limitations | Data sources | Current version
What you see
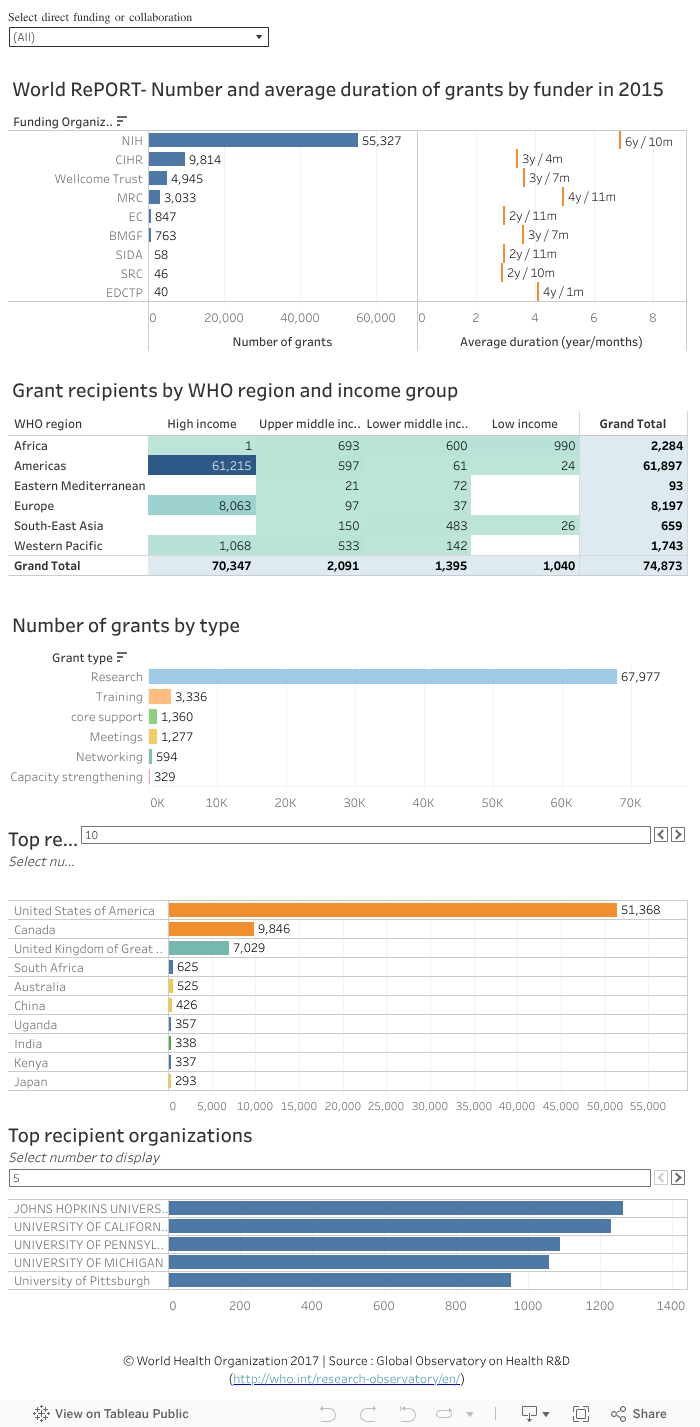
The data visualization above shows grant information from World RePORT for the year 2015, as follows:
- Number and average duration of grants by funder (first chart).
- Grant recipients by WHO region and income group (second chart).
- Number of grants by type (third chart).
- Top recipient countries and territories, colour coded by WHO region (fourth chart).
- Top recipient organizations (fifth chart).
The top chart shows the total number of research grants, regardless of the number of recipients involved. However, a multi-recipient grant is counted once for each participating region or income group in the second chart, and once for each participating country or for each participating research organization in the bottom charts (see Scope, analysis and limitations of the data below).
Points to note:
Among the direct grants provided by the 9 funders in 2015 (use the dropdown option at the top of the data visualization to filter for direct funding):
- As shown in the top chart, the United States of America’s National Institutes of Health (NIH) funded the highest number of research grants (51,253) and had the highest average grant duration (6 years and 9 months).
- Of grant recipients by income group, low income countries received only 0.3% of all direct grants (second chart).
- More than 90% of direct grants were directed to research (63,231), followed by training (4.4%) and core support (1.7%) (third chart).
- Among the 381 direct grants received by African countries (click on Africa in the second chart), South Africa received the highest number of grants (141; 37.0 %), followed by Uganda (68; 17.8%) and the Gambia (35; 9.2%) (fourth chart).
- The WHO Eastern Mediterranean region received the least number of direct grants (11) (click on Eastern Mediterranean in the second chart). These grants were provided by 5 of the 9 funders. Recipient countries were Pakistan, Lebanon and Egypt (fourth chart).
Focusing on the collaborations resulting from direct grants by the 9 funders in 2015 (use the dropdown option at the top of the data visualization to filter for collaboration):
- Overall, the WHO African and the Western Pacific regions benefited the most from collaborations with recipients of direct grants, with 1,903 and 1,651 collaborations occurring in these two regions respectively (second chart).
- As shown in the third chart, 81.4% of all the collaborations were on research (4,746), followed by meetings (291; 5.0%) and training (267; 4.6%).
- The top 3 countries in Africa that benefited from collaborations (click on Africa in the second chart) were South Africa, Kenya and Uganda (484, 305 and 289 collaborative grants respectively; fourth chart).
- University of Cape Town was the top recipient organization with collaborative arrangements, followed by Makerere University (108 and 106 respectively; fifth chart).
Exploring the data further:
- Select a funder, a WHO region, a country or any other category (by clicking on a bar in a chart or a cell in a table) to filter data for the desired selection in the other charts.
- Hover the cursor on a data element (a bar or a cell) to see more information in a popup window (for example, percentages and other relevant categorisations). The popup information is updated automatically for any of the selections made by filtering the data in the previous step.
- Hold the ‘Ctrl’ key to select more than one option, for example two regions.
- For recipient countries or organizations, select a different number to display by clicking on the ‘>’ or ‘<’ symbol="" above="" the="" relevant="">
- Undo a selection by clicking ‘undo’ or ‘reset’ near the bottom of the page or by clicking the same element again.
Scope and limitations
- The World RePORT is hosted by the United States of America’s National Institutes of Health and managed through a steering committee of the agencies providing data.
- To date, the World RePORT includes data reported by 12 major funders of health research. Not all of these funders report on a yearly basis. For example, in 2015 only 9 of the 12 funders reported data (for grants in 2015).
- Collectively, 8 of the 12 funders that have reported since 2012 make up approximately 78% of the annual health research expenditures of 55 major public and philanthropic funders of health research according to Viergever & Hendriks 2015.
Analysis
- The data presented in this visualization utilize classifications that are not mutually exclusive. For example, a research grant can include recipients from multiple regions, income groups, countries and organizations. In this case, the research grant will be counted once per funder in the top chart but once per data element in the lower charts. The total number of research grants across the charts is therefore not equivalent.
- Automated data mining was used to classify grants by type using synonyms for these extracted from the title of the grant.
Limitations of the data
- For some funders, especially those with relatively new or inflexible data collection platforms, the data do not accurately reflect the scale of research investments or collaborations between recipients of grants.
- To date, available information on direct grants that resulted in collaborations with other countries or organizations does not allow linking the collaborators with the recipients of the direct grants.
- This analysis only reports the number of grants. It does not reflect the volume of investments across countries or categories of funding. While investments data exist for some funders (such as the NIH), it does not yet exist in a standardized way across all reporting funders. This area is expected to be better addressed in future years as a result of the collaborative efforts among the reporting funders of the World RePORT to improve data collection and reporting standards.
- Data currently available from the World RePORT platform does not allow for categorization of grants by disease area. Work to classify grants by disease area using data mining techniques is currently underway at the WHO Global Observatory on Health R&D, in collaboration with World RePORT.
- This analysis will be updated when new data becomes available; however time lags with the scheduled updates by the data source are inevitable. Accuracy and completeness of the information is the responsibility of the data source, see terms and conditions of use.