Number of grants for biomedical research by funder, type of grant, duration and recipients (World RePORT)
Published: January 2021
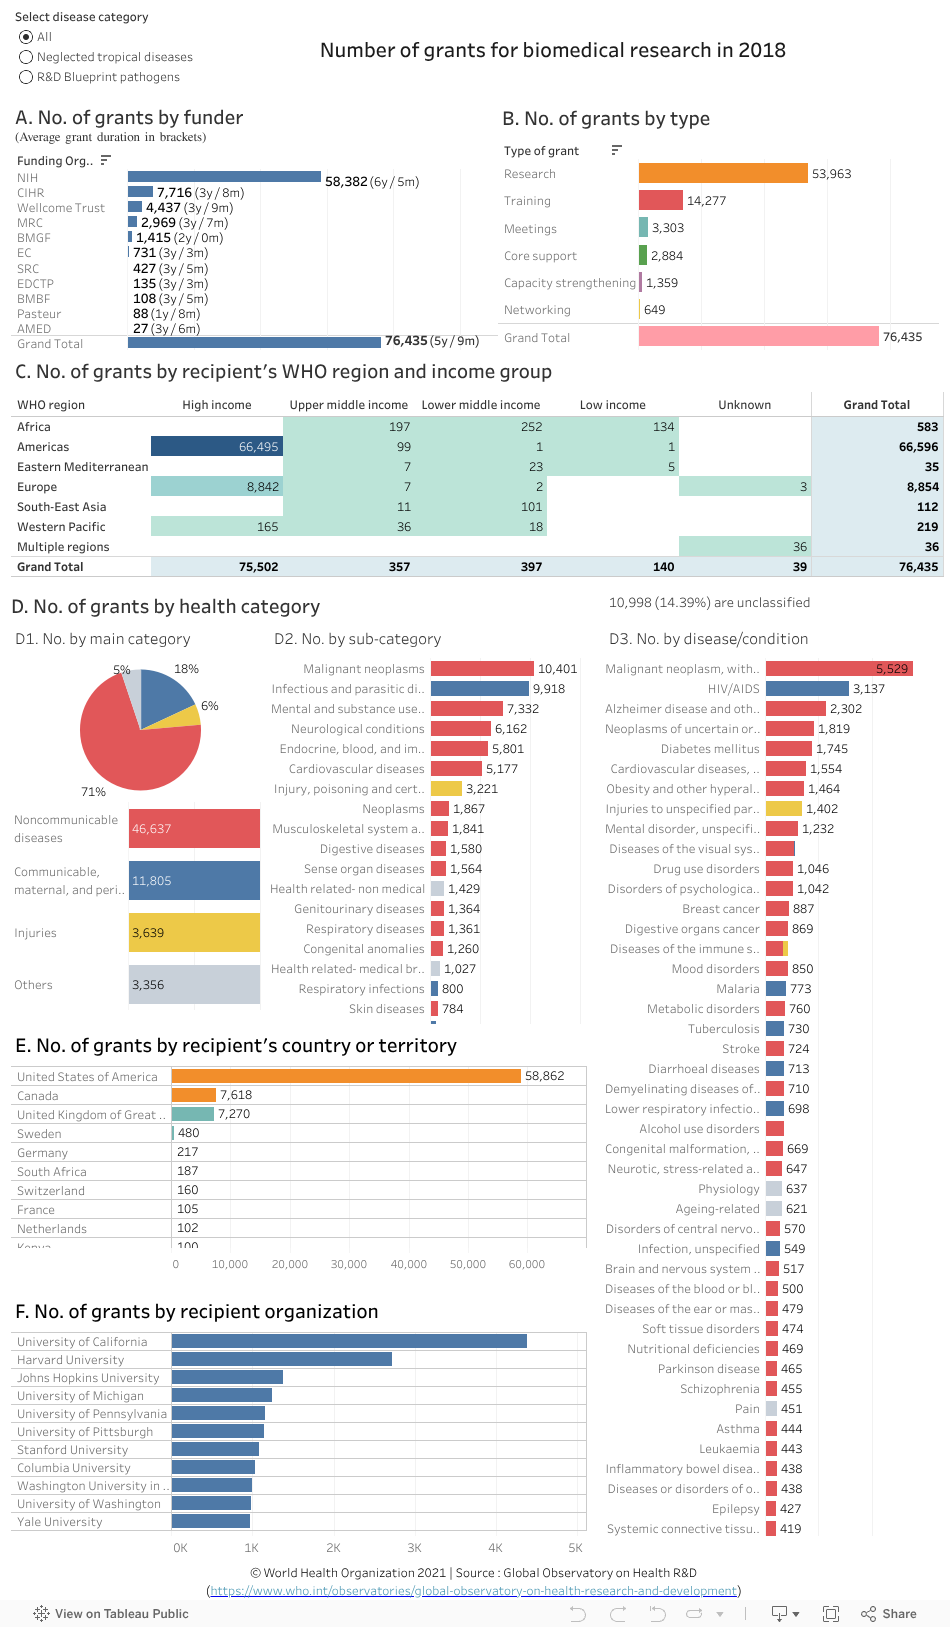
Since 2012, World RePORT has collected grants data for biomedical research from a growing number of major funders of health research. Presented here is information on direct (primary) biomedical grants awarded in 2018 by 11 funders that reported to World RePORT. (See more about the scope and limitations of World RePORT data below.)
See also:
What you see | Scope and limitations | Data sources | Current version
What you see
The data visualization above shows the number of direct grants based on data from World RePORT for the year 2018, by:
- Funder (with average grant duration) (chart A)
- Type of grant (chart B)
- Recipient’s WHO region and income group (chart C).
- Health category (colour coded by main health category) (chart D - with data broken down into charts D1, D2 and D3)
- Recipient organization (chart E)
- Recipient’s country or territory (chart F)
With respect to disease focus, grants for neglected tropical diseases or ‘R&D Blueprint pathogens’ can be viewed separately (select desired options using the circular buttons at the top left of the data visualization).
Points to note:
Among the grants provided in 2018 by the 11 funders:
- The total number of grants was 76,435. As shown in chart A, the United States of America’s National Institutes of Health (NIH) awarded the highest number of grants (58,382) and gave the highest average grant duration (6 years and 5 months).
- 70.6% of these grants was awarded for research (53,963), followed by training (19%; 13,008) and meetings (4%; 3,303) (chart B).
- Of grant recipients by income group, low income countries received only 0.2% (140) of all grants (chart C).
- Among the 583 grants received by African countries (click on the Africa region in chart C), South Africa received the highest number of grants (32%; 187), followed by Kenya (17%; 100) and Uganda ((11%; 65) (chart E).
- Almost three quarters of all grants were for noncommunicable diseases (71%; 46,637), followed by communicable, maternal, and perinatal conditions (18%; 11,805) and injuries (6%; 3,639) (chart D1).
- Among noncommunicable diseases, the largest proportion was for malignant neoplasms (22%; 10,401), followed by mental and substance use disorders (16%; 7,332), neurological conditions (13%; 6,162), and endocrine, blood and immune disorders (12%; 5,801). (Select the noncommunicable disease category in chart D1 and see distribution by health category in chart D2).
- Among communicable, maternal, and perinatal conditions (select this category in chart D1), nearly 85% were for infectious and parasitic diseases (9,918), followed by respiratory infections (7%; 800), neonatal conditions (5%; 597) and maternal conditions (4%; 490) (chart D2).
- Of all grants for neglected tropical diseases (select this disease category at the top right), dengue (20%; 123), leishmaniasis (14%,86) and trachoma (9%; 54) are the top three diseases that received the highest number of grants (see chart D3).
- 86% of all grants for R&D Blueprint pathogens were for Zika virus disease (47%; 202), Ebola virus disease (34%; 147), and severe acute respiratory syndrome (5%; 22) (Select this disease category at the top right and see chart D3).
- Overall, almost 77% of all grants awarded for biomedical research were allocated to recipient organizations in the United States of America (chart E), with the University of California receiving the highest number of grants (4,383) (chart F).
Exploring the data further
- Select a funder, a WHO region, a country or any other category (by clicking on a bar in a chart or a cell in a table) to filter data for the desired selection in the other charts.
-- For example, by selecting "Malignant neoplasms" in chart D2, chart D3 shows that breast cancer (aside from malignant neoplasms without specification of sites) received the highest number of grants (887), followed by digestive organs cancer (869) and brain and nervous systems cancers (517). - Hover the cursor on a data element (a bar or a cell) to see more information in a popup window (for example, percentages and other relevant categorizations). The popup information is updated automatically for any of the selections made by filtering the data in the previous step.
- Hold the ‘Ctrl’ key to select more than one option, for example two regions.
- Undo a selection by clicking ‘undo’ or ‘reset’ near the bottom of the page or by clicking the same element again.
Scope, analysis and limitations of the data
Scope
- The World RePORT is hosted by the United States of America’s National Institutes of Health and managed through a steering committee of the agencies providing data.
- Not all funders who provide data to World RePORT report on a yearly basis. For example, at the time of this analysis, only 11 funders had reported data for grants awarded in 2018.
- The World RePORT data include direct (primary) grants provided to recipient institutions as well as collaborations with other institutions resulting from these grants (indirect grants administered by recipient institutions). This data visualization focuses on direct grants. Indirect grants resulting from collaborations with the primary recipient institutions are analysed separately.
- Collectively, 8 of the 12 funders that have reported since 2012 make up approximately 78% of the annual health research expenditures of 55 major public and philanthropic funders of health research according to Viergever & Hendriks 2015.
Analysis
- Automated data mining was used to generate information on the type of grant and health category using text-based data fields for each grant.
- To determine the type of grant, synonyms for the type of grant categories listed in the data visualization were extracted from the title or abstract (if available) of the grant record.
- To assign a health category to each grant, the Observatory’s compiled list of disease synonyms was used as described below. The list was compiled using as a base the Unified Medical Language System (UMLS) and the 10th version of the International Classification of Diseases. This was complemented by synonyms drawn from the data, mostly to account for errors in data entry such as spelling errors or use of abbreviations.
- An automated algorithm was applied to two data fields, the grant’s title and abstract, using the list of disease synonyms to generate the disease classification field used in this analysis. The algorithm stops if a match is identified using the title field, if not a match using the abstract field is pursued. The first match closer to the beginning of the text field was selected. This was considered the primary disease focus of the grant. It is possible that a grant has more than one disease focus; this is not captured in this analysis.
- The algorithm was refined through various iterations and will continue to be refined in future updates but as with any automated algorithm, it is likely that some grants were not correctly matched. A full description of the methods and approach is available in this paper: Resource allocation for biomedical research: analysis of investments by major funders.
Limitations of the data
- For some funders, especially those with relatively new or fixed data collection platforms, the data do not accurately reflect the scale of research investments or collaborations between recipients of grants. Most funders did not include their intramural investments which can be substantial, notably the NIH and the Institut Pasteur, the latter is estimated by the data source to represent only around 8% of their entire grants.
- This analysis will be updated when new data becomes available; however, time lags with the scheduled updates by the data source are inevitable. Accuracy and completeness of the information is the responsibility of the data source, see terms and conditions of use.