R&D funding flows for neglected diseases by disease, year and funding category
Published: November 2021
The product-related R&D funding flows for neglected diseases are collected from the Policy Cures Research G-FINDER survey. For 2019, funding data were collected from private, public and philanthropic organizations, on all types of product-related R&D, basic research and platform technology covering 36 neglected diseases (note: the disease names have been reclassified here, see the classifications and standards section for the rationale and approach).
See also:
What you see | Scope and limitations | Data sources | Current version
What you see
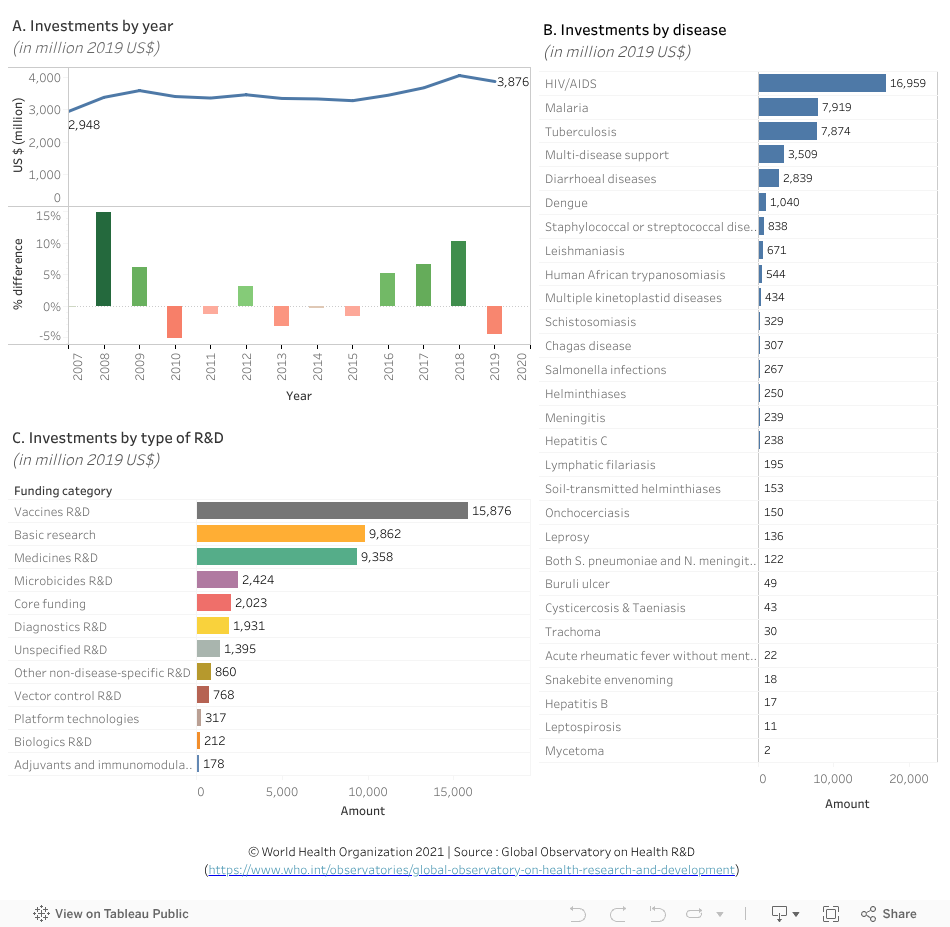
The data visualization illustrates funding trends by year, and % differences with the previous year (chart A), by disease (chart B), and type of R&D (chart C) for the period 2007-2019. All funding data has been adjusted for inflation, and is reported in 2019 US dollars (US$) (adjustment performed by the data source).
Points to note:
- The G-Finder survey data underestimate the total R&D investments for these diseases as reporting is incomplete and needs to be interpreted cautiously due to the scope restrictions of the survey. Survey participation was slightly altered by the COVID-19 pandemic, with around 96% of the 2018 data captured in the 2019 survey.
- In 2019, investments in neglected diseases R&D amounted to around US$ 3.9 billion.
- As was the case in 2018, investments in neglected diseases R&D during 2019 remained highly focused on HIV/AIDS, tuberculosis, and malaria. Together, investments in R&D for these three diseases account for around 71% of total investments in neglected diseases with US$ 1,474 million for HIV/AIDS, US$ 670 million for tuberculosis, and US$ 603 million for malaria (click on the bar for 2019 on chart A to display data in chart B).
- Investments in R&D for several neglected diseases have declined in 2019 compared to 2018, notably for human African trypanosomiasis (-26%), lymphatic filariasis (-26%) and helminthiases (-19%). On the other hand, some diseases have seen an increase in investments in 2019, notably investments for chagas disease (+78 %), snakebite envenoming (+36%) and hepatitis B (+10%) (click on each disease on chart B and see the bar for 2019 on chart A)
- Over the 13 years of investments on R&D for neglected diseases (2007-2019):
--vaccine R&D continues to occupy the top position in terms of investments in R&D for neglected diseases (US$ 15.88 billion) followed by basic research (US$ 9.86 billion), with a decrease of 6% and 1% respectively, between 2018 and 2019. These two investments categories are followed by medicines R&D (US$ 9.36 billion), noting that investments in this category have been increasing over the past 6 years with an overall 52% increase from its level in 2013 (US$ 0.6 billion) compared to 2019 (US$ 0.9 billion) (click on the bar for each category in chart C and compare year to year differences in chart A by hovering over the bars or year points on the trend line).
-- US$ 1.40 billion of unspecified R&D funding accounts for investments that, while directed to specific diseases, have not been allocated to a specific R&D funding category(click on the “unspecified R&D” category in chart C to display the diseases concerned in chart B).
Scope and limitations of the data source
The data must be interpreted cautiously because of the specific scope restrictions of the G-FINDER survey (see link below for detail). The scope of the G-FINDER survey is determined by applying the following three criteria for neglected diseases. (R&D investments which do not meet these criteria are excluded.)
- The disease disproportionately affects people in developing countries.
- There is a need for new products (i.e. there is either no existing product, or improved or additional products are needed).
- There is market failure in developing these new products (i.e. there is an insufficient commercial market to attract R&D by private industry).
In addition, the funding data from industry is presented in an aggregated form for confidentiality. This means that funding levels by disease and R&D category substantially underestimate the actual investments in these diseases within the scope of G-FINDER described above.
The COVID-19 pandemic slightly altered the participation in the 2019 G-Finder survey, with around 96% of the 2018 data captured in the 2019 survey. Interpretation of change in the overall funding and that of particular diseases, notably for tuberculosis, bacterial pneumonia and meningitis, salmonella infections, and diarrhoeal diseases, need to take this into account.
To explore the data further
- Select a single year (by clicking on a time point on the trend line or on the year-specific bar) to filter annual funding data by disease and R&D type and to compare year to year estimates and differences (chart A).
- Select a disease to filter annual funding data by year and R&D type (chart B).
- Select by R&D type to filter annual funding data by year and diseases -- For example, selecting vaccines R&D (chart C) shows that over 60% of total funding for neglected diseases on vaccines R&D is directed to HIV/AIDS (US$ 9.71 billion) (chart B).
- Hover the cursor on a bar in a graphic to see more information in a popup window (e.g. year, investment amount, % difference (with previous year), disease, R&D type)
- Undo a selection by clicking ‘undo’ or ‘reset’ near the bottom of the page or by clicking the same element again.